Current Market Snapshot – Nifty 50
-
Index Name: Nifty 50 (NSE)
-
Timeframe: Daily (1D)
-
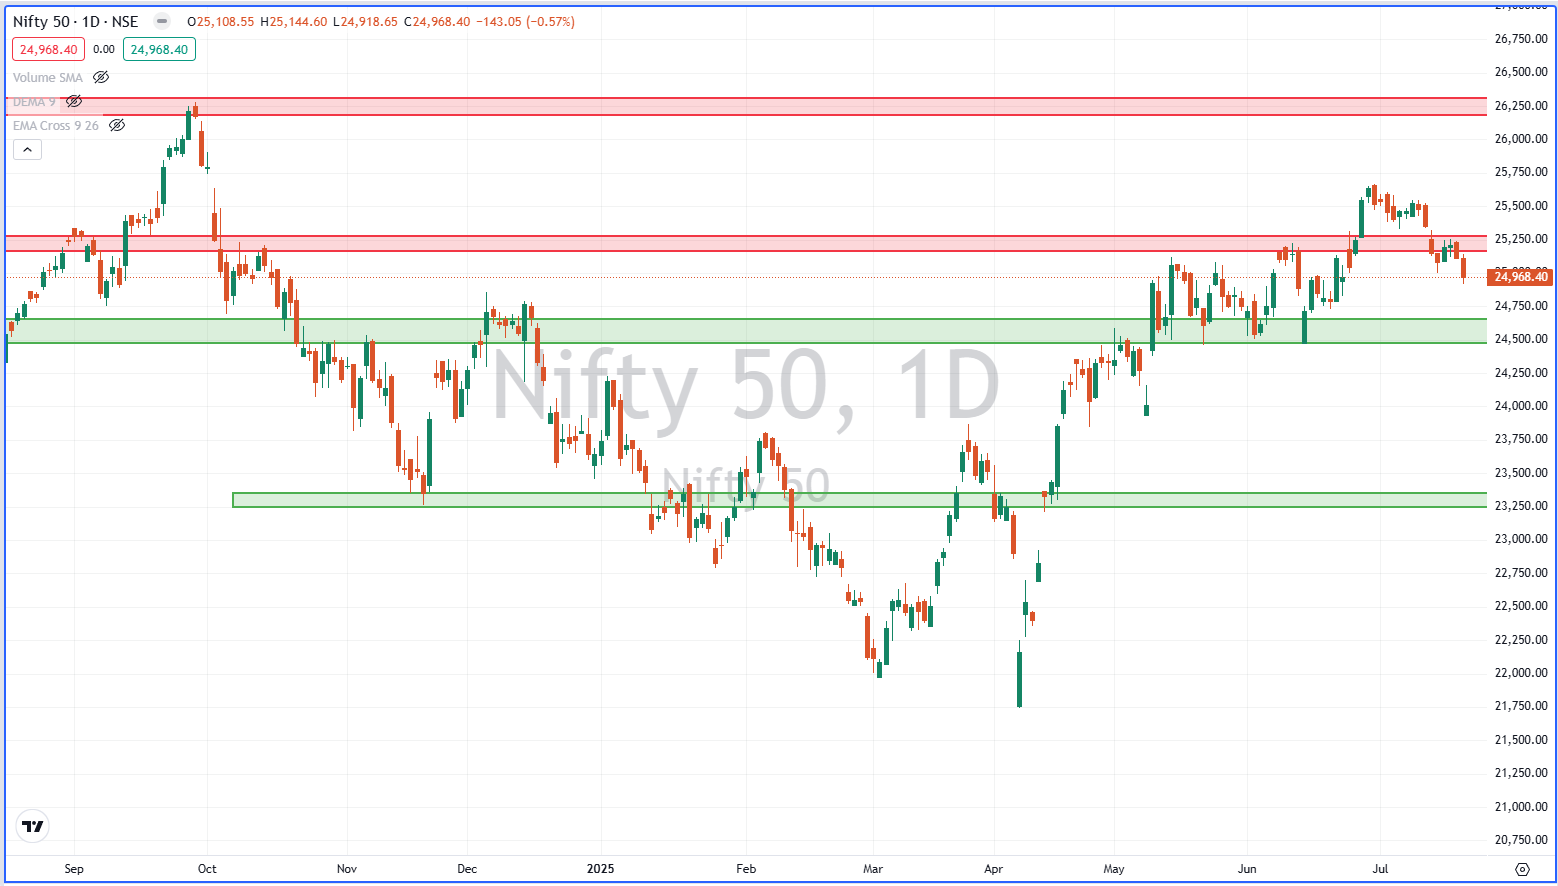
Current Price: ₹24,968.40
-
Day Range: ₹24,918.65 – ₹25,144.60
-
Previous Close: ₹25,111.45
-
Change: -143.05 pts (-0.57%)
-
Last Updated: July 19, 2025
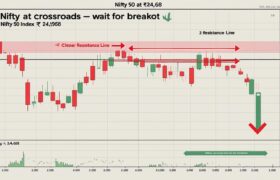
📈 Nifty 50 Technical Chart Analysis (Daily)
The Nifty 50 daily chart reveals a classic tug-of-war near the psychological level of 25,000, a zone acting as both short-term resistance and a trigger point for broader market sentiment. As seen in the chart, multiple green and red horizontal zones highlight key support-resistance areas, which are currently playing a major role in the market’s sideways to corrective behavior.
🔍 Major Observations from the Chart
🔺 Resistance Zones (Red Horizontal Lines)
-
25,250 – 25,450: Strong recent resistance zone. Price failed multiple times near this level.
-
25,800 – 26,300: Historical resistance from the October 2024 highs.
🔻 Support Zones (Green Horizontal Lines)
-
24,700 – 24,500: Immediate demand zone; a critical support that’s been tested 3–4 times.
-
23,200 – 23,500: Major swing support from March–April 2025.
-
21,750 – 22,250: Last resort bearish support if things get ugly.
📊 Candlestick & Price Action Insights
-
Recent candles show selling pressure near 25,250, with upper wicks indicating bulls’ failure to sustain higher levels.
-
Bearish engulfing pattern visible after the peak in early July.
-
No clear bullish reversal yet near ₹25,000; sentiment leans cautious.
🧠 Trend Analysis – What Is Market Indicating?
-
📉 Short-Term Trend: Sideways to mildly bearish
-
📈 Medium-Term Trend: Still bullish (uptrend from April 2025 intact)
-
🟰 EMA Status: Price slightly below the short-term exponential moving average, showing loss of momentum
📌 Nifty 50 Market Sentiment
The market sentiment has slightly cooled off after the euphoric rally post-election results in April. With IT, banks, and energy stocks showing mixed cues, index is consolidating between 24,500–25,250.
There is sectoral rotation but no clear leadership, which means volatility may persist till Nifty breaks either of the range zones.
📍 Key Levels to Watch This Week
| Zone | Type | Action |
|---|---|---|
| 25,250 – 25,450 | Resistance | Fresh breakout needed for next rally |
| 24,700 – 24,500 | Support | Must hold to avoid deeper correction |
| 23,200 – 23,500 | Major Support | Bounce expected if tested again |
| 26,000+ | Bullish Target | Possible on breakout and volume spike |
📣 What Retail Traders Should Do?
🔹 If Bullish:
-
Wait for a close above ₹25,250 with strong volumes.
-
Avoid buying aggressively near resistance zones.
-
Focus on sector-specific breakouts (IT, infra, banks).
🔹 If Bearish:
-
Short opportunities may arise on failure to hold ₹24,700 zone.
-
Keep tight stop-loss above ₹25,250.
-
Watch for volume confirmation in breakdowns.
🔹 Neutral View:
-
Consider straddle or strangle options strategy if expecting volatility.
-
Keep strict SLs and book profits regularly in swing positions.
🧾 Nifty Derivatives Data Hints
-
Option Chain: Heavy call writing at 25,200 and 25,500 CE
-
Put Writers: Holding 24,700 and 24,500 PE
-
FII Data: Recent selling pressure seen; DIIs providing some cushion
This data confirms that market participants are playing within the defined zones, expecting no big breakout just yet.
🔄 Share Market Impact
The current Nifty consolidation may cause stock-specific choppiness. If Nifty fails to break above ₹25,250 this week:
-
Bank Nifty and IT Index may drag.
-
Defensive sectors like FMCG and Pharma could outperform.
-
Broader market could see increased volatility.
However, if Nifty finds support and reverses from ₹24,700–24,800:
-
Could trigger short-covering rally
-
Midcaps and Smallcaps may benefit the most
🏢 A Brief on Nifty 50 Index
-
Managed By: NSE Indices Limited
-
Constituents: Top 50 companies across sectors
-
Launched: 1996
-
Sector Leaders: HDFC Bank, Reliance, Infosys, ICICI Bank, TCS
-
Weighting Method: Free-float market cap
It’s a benchmark for Indian equities and reflects overall economic and investor sentiment. Hence, its levels hold crucial importance.
📉 Historical Perspective
-
Last time Nifty failed at the same ₹25,250–25,450 zone was in October 2024, post which we saw a major 10% fall.
-
Any repeat pattern could create fear in the markets.
-
But this time, macro and earnings are relatively supportive.
🧩 Final Takeaway
🔔 Nifty 50 is currently at a critical juncture.
-
Breakout above ₹25,250 = bull party continues.
-
Breakdown below ₹24,500 = bears may take charge.
As a trader/investor, the key is to avoid impulsive trades and align with structure + data. The broader uptrend is still intact, but short-term caution is advised.
🏷️ Categories & Tags
Categories: Nifty 50, Technical Analysis, Indian Stock Market, Trading Strategy
Tags: Nifty Chart, Nifty Resistance, Nifty Support Today, Nifty Trend July 2025, Market Outlook India, Index Analysis, NSE Technical Levels
Stock Market Disclaimer
Disclaimer: This post is for informational and educational purposes only and does not constitute financial advice or a recommendation to buy/sell any stock or share. Investing in the stock market involves risk. Past performance is not indicative of future results. Always conduct your own research or consult a licensed financial advisor before making investment decisions.