🌐 Headline Summary: Market Ends Red Amid Profit Booking
Indian benchmark indices witnessed a broad-based decline on July 29, 2025, with frontline indices like Nifty 50, Bank Nifty, and Fin Nifty closing notably lower. Nifty 50 slipped by -156.10 points (-0.63%), while Bank Nifty and Fin Nifty underperformed further with losses of -0.79% and -0.72% respectively. Midcap Nifty, although relatively resilient, also ended in red territory, down 0.21%.
📌 Quick Snapshot:
| Index | % Change | Trend Summary |
|---|---|---|
| Nifty 50 | -0.63% | Rejection near 24,890; weak close |
| Bank Nifty | -0.79% | Heavy selling pressure, failed to hold 56,000 |
| Fin Nifty | -0.72% | Lower highs forming, caution advised |
| Midcap Nifty | -0.21% | Range-bound, minor dip, but relatively strong |
📈 1. Nifty 50 Technical Analysis
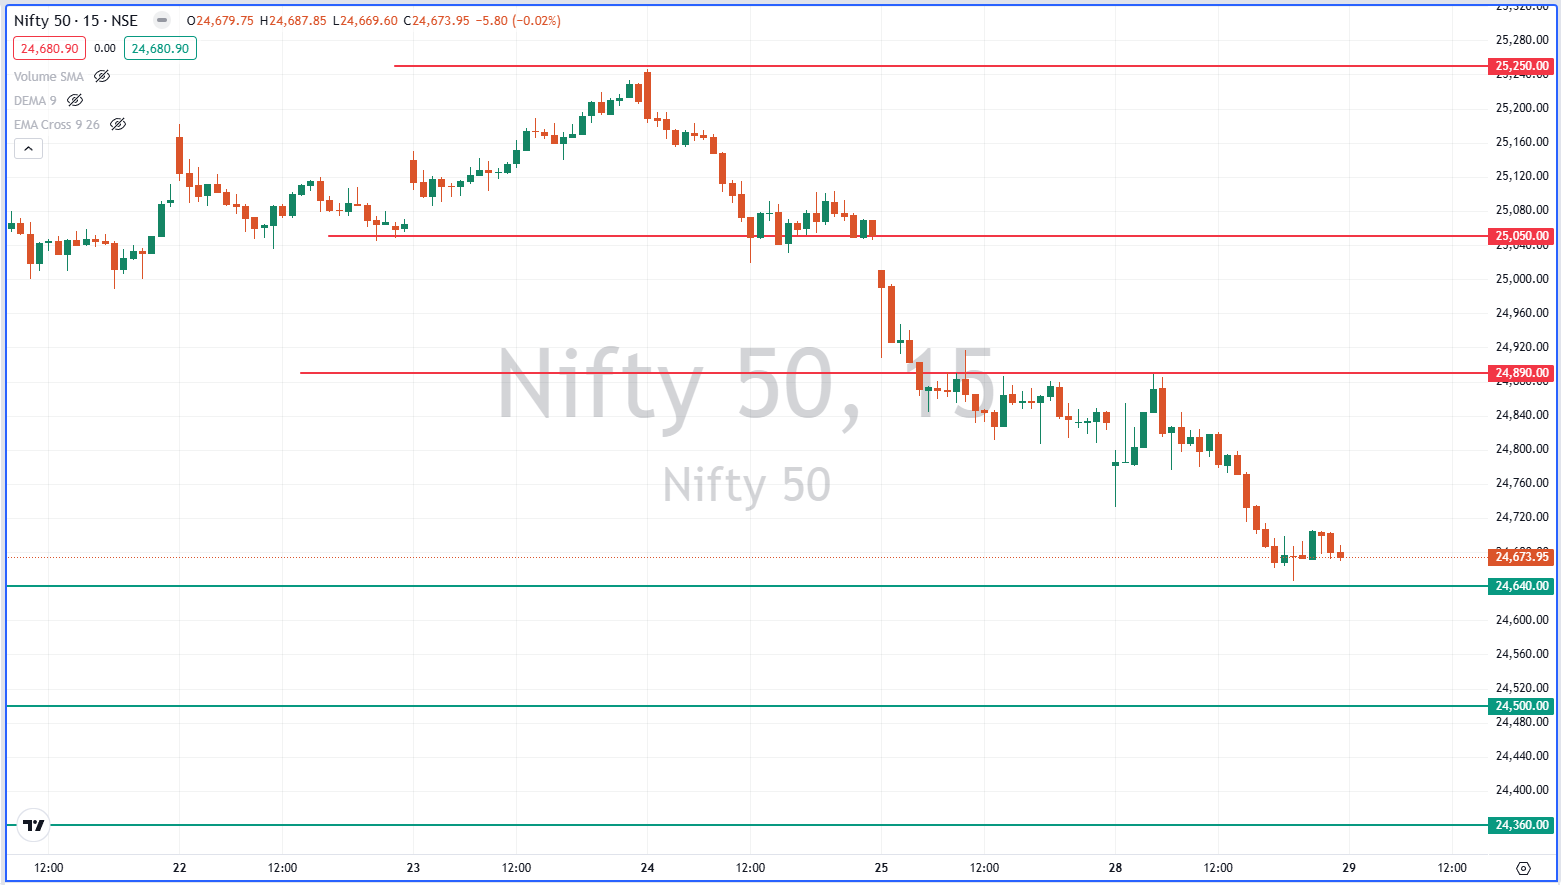
🔹 Current Price: 24,680.90
🔽 Change: -156.10 (-0.63%)
🔻 Previous Close: 24,837.00
🕘 Open: 24,782.45
📈 High: 24,889.20
📉 Low: 24,646.60
🔍 Chart & Price Structure Breakdown:
-
Nifty opened with a mild negative bias around 24,782, indicating initial hesitation among bulls after Friday’s close.
-
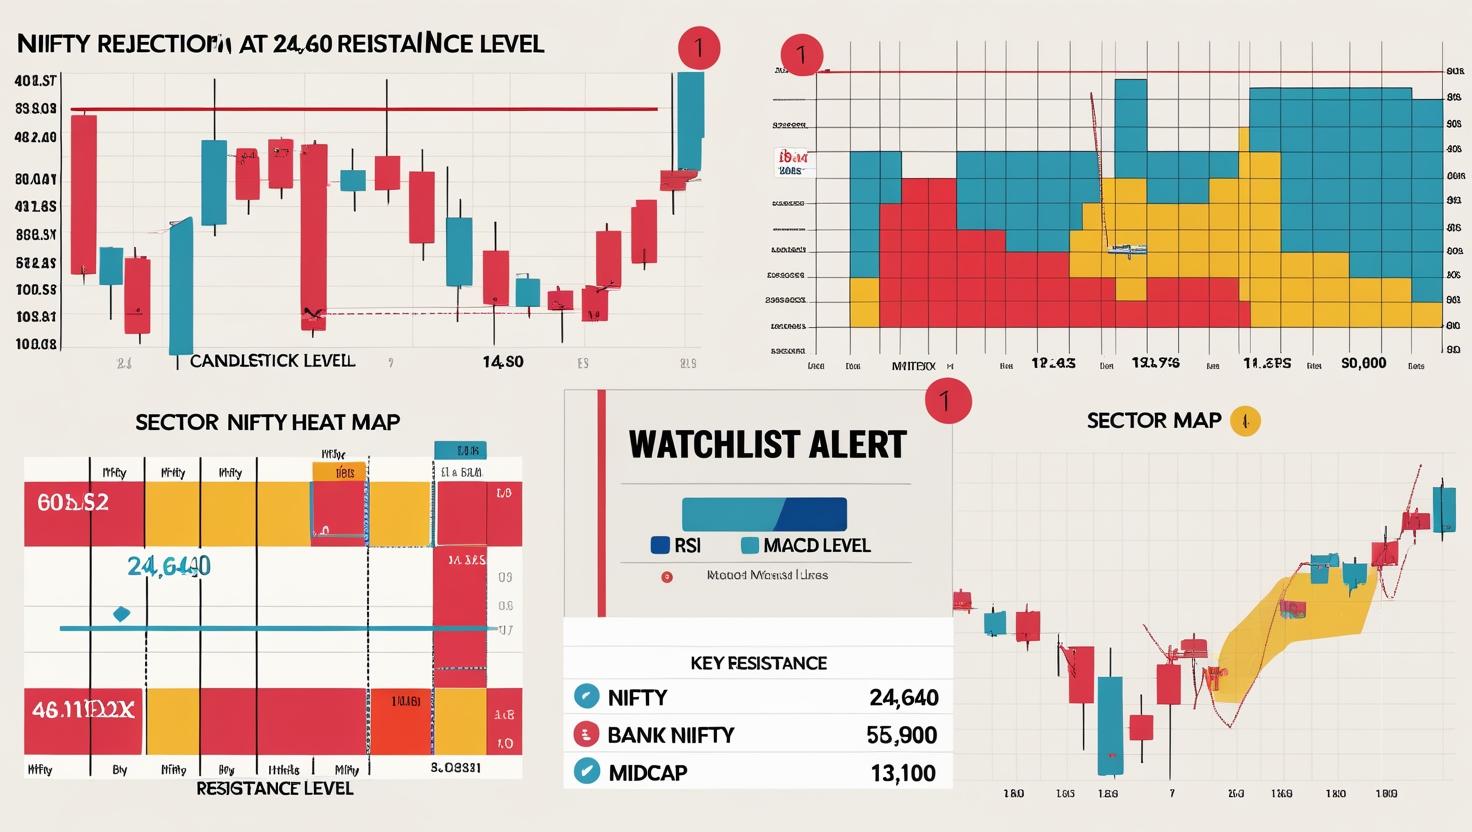
The index made a failed attempt to retest the 24,900 resistance zone, only to face rejection near 24,889.
-
Sustained selling pressure dragged it to an intraday low of 24,646, marginally above key support.
-
Closing near day’s low signals bearish sentiment heading into the next session.
🔔 Key Technical Zones:
-
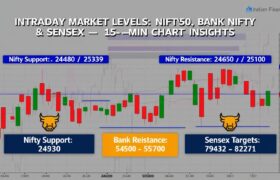
Support Levels: 24,640 / 24,500 / 24,360
-
Resistance Levels: 24,890 / 25,050 / 25,250
-
RSI (Daily): Likely cooling off from overbought territory; around 54-58
-
MACD: Bearish crossover with slowing momentum
📌 Verdict:
Nifty has entered a short-term corrective phase after multiple sessions of over extension. As long as 24,640 holds, a bounce is possible. However, a break below this may trigger a slide toward 24,500–24,360. The 25,000 mark remains a psychological barrier.
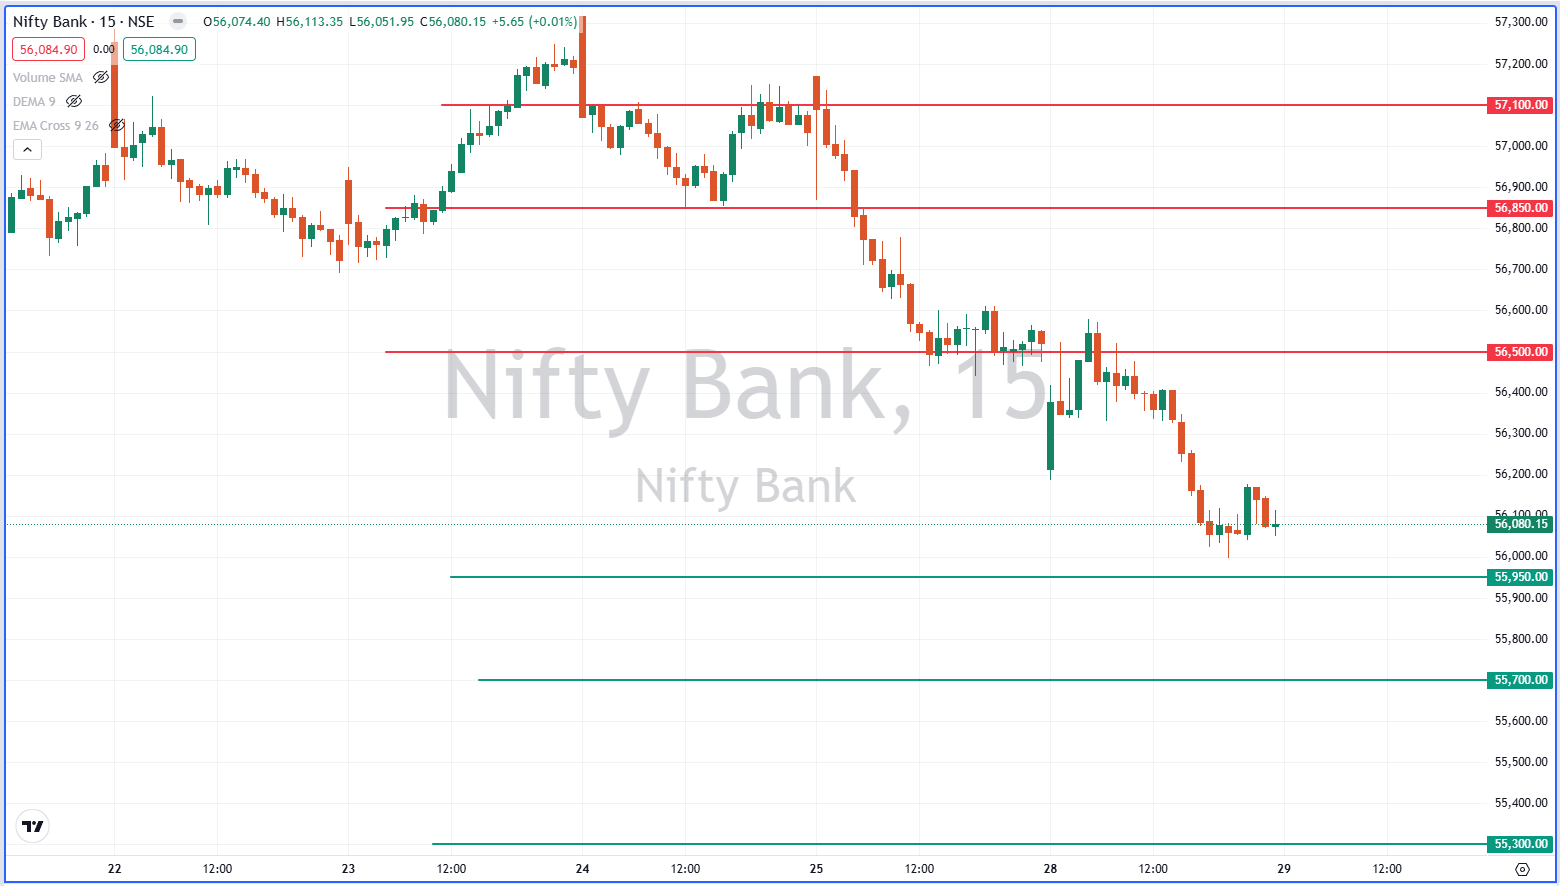
🏦 2. Bank Nifty Analysis: Weakness Deepens
🔹 Current Price: 56,084.90
🔽 Change: -444.00 (-0.79%)
🔻 Previous Close: 56,528.90
🕘 Open: 56,215.10
📈 High: 56,578.40
📉 Low: 55,997.45
🔍 Chart & Price Action Insight:
-
Bank Nifty’s weakness intensified as it failed to sustain above its open of 56,215.
-
After a brief high of 56,578, selling kicked in, breaking through 56,000 support.
-
Closing below 56,100 and near the low suggests bearish continuation.
🔔 Key Technical Zones:
-
Support Levels: 55,950 / 55,700 / 55,300
-
Resistance Levels: 56,500 / 56,850 / 57,100
-
RSI: Dropping under 50 — signs of declining momentum
-
MACD: Bearish divergence in play
📌 Verdict:
Banking stocks are clearly under distribution. With closing beneath the psychological 56,000 mark, more pressure could be seen. Keep a close watch on 55,950—a breakdown here may lead to swift downside toward 55,300.
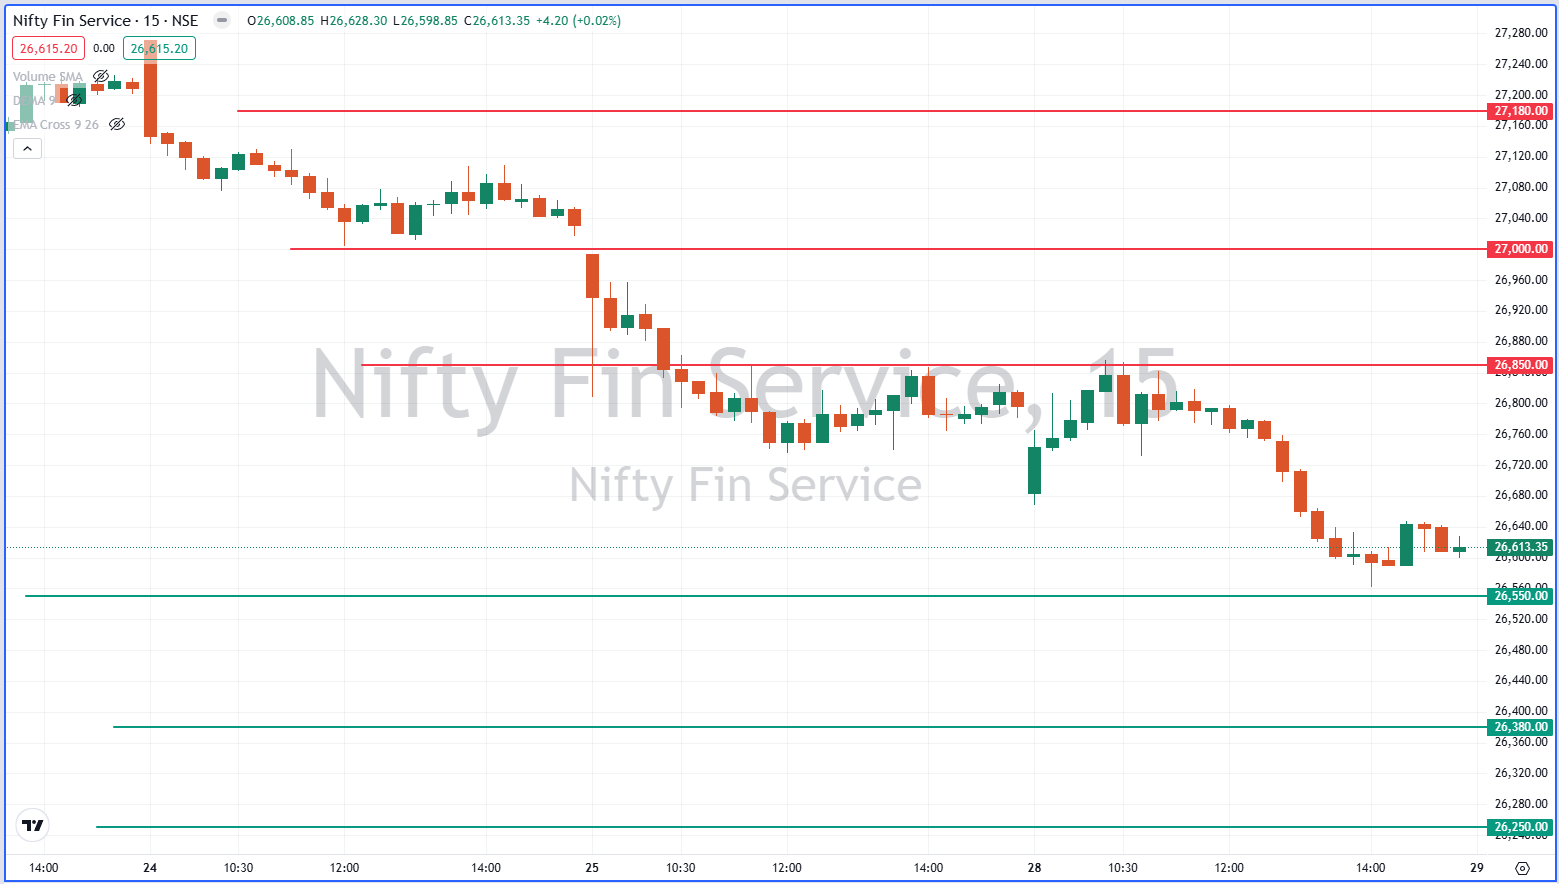
💰 3. Fin Nifty: Mirrors Bank Nifty Weakness
🔹 Current Price: 26,615.20
🔽 Change: -192.80 (-0.72%)
🔻 Previous Close: 26,808.00
🕘 Open: 26,684.35
📈 High: 26,856.80
📉 Low: 26,562.10
🔍 Chart & Sentiment Overview:
-
Financial Services Index echoed Bank Nifty’s moves, opening flat and showing early signs of rejection.
-
Despite a high near 26,856, consistent pressure saw a low of 26,562.
-
Closing near the day’s bottom shows bearish sentiment with potential for more correction.
🔔 Key Technical Zones:
-
Support Levels: 26,550 / 26,380 / 26,250
-
Resistance Levels: 26,850 / 27,000 / 27,180
-
RSI: Sliding below 52 – weakening hands
-
Volume: Possibly lower, signaling buyer exhaustion
📌 Verdict:
FinNifty’s price action reflects distribution by institutional players. Unless a strong reversal comes in with volume, weakness may continue. Watch for a breakdown below 26,550 as a trigger for more downside.
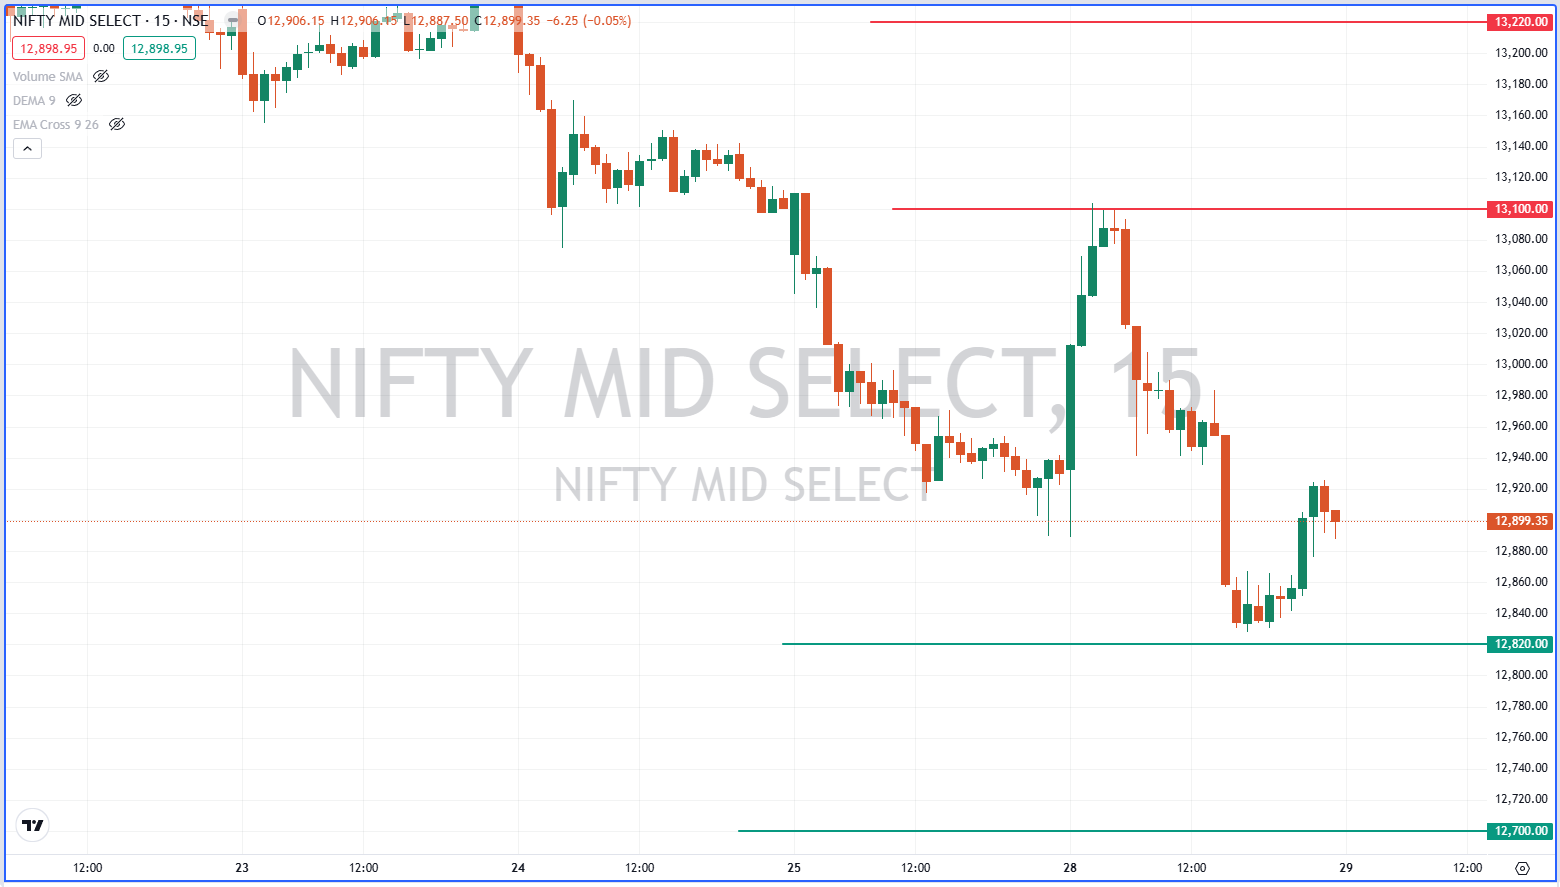
📊 4. Midcap Nifty: Resilient but Cautious
🔹 Current Price: 12,898.95
🔽 Change: -26.95 (-0.21%)
🔻 Previous Close: 12,925.90
🕘 Open: 12,933.00
📈 High: 13,103.40
📉 Low: 12,827.85
🔍 Technical Picture:
-
The Midcap index continues to remain in a sideways consolidation, relatively outperforming its peers.
-
It attempted to break above 13,100, but failed to sustain.
-
The range of 12,820–13,100 has become a tight zone for the index.
🔔 Key Technical Zones:
-
Support Levels: 12,820 / 12,700
-
Resistance Levels: 13,100 / 13,220
-
RSI: Around 59 – no clear signal
-
Price Pattern: Inside bar formation may lead to a breakout soon
📌 Verdict:
Despite broader market weakness, Midcaps are showing resilience. A breakout above 13,100 could invite fresh inflows, while a breakdown below 12,820 might attract short positions. Wait for confirmation.
🧠 Institutional Flow & Sentiment Overview
-
FIIs were seen as net sellers in the previous session, especially in financial and banking names.
-
DIIs showed some buying in selective midcaps and FMCG.
-
Global cues remain mixed, with US futures turning slightly negative ahead of FOMC guidance this week.
-
Crude oil and USDINR remain range-bound, keeping inflation concerns muted for now.
📅 Tomorrow’s Trade Setup – July 29, 2025
✅ Bullish Bias If:
-
Nifty sustains above 24,750 and crosses 24,890 with volume.
-
Bank Nifty reclaims 56,500 zone with strength.
-
Midcap Nifty breaks and sustains above 13,100 decisively.
❌ Bearish Bias If:
-
Nifty breaks 24,640, targeting 24,500–24,360.
-
Bank Nifty breaches 55,950, creating room for a sharp fall.
-
Fin Nifty fails to hold 26,550 and drops toward 26,250.
📉 Preferred Strategy:
“Sell on rise near resistance unless trend reversal confirmation emerges with high volume.”
💡 Retail Traders Takeaway
-
Avoid aggressive long positions near resistance zones.
-
Midcaps may offer stock-specific opportunities on breakout setups.
-
Keep tight stop losses as volatility is expected to increase.
-
Consider trailing profits if already holding index longs from lower levels.
🧮 Conclusion:
The Indian markets have entered a short-term corrective mood, led by profit booking in banking and financial sectors. Technical indicators are flashing caution across major indices. However, Midcap resilience gives hope for rotational plays in the coming sessions. Stay alert at key support zones, and trade with a disciplined strategy in this range bound but sensitive market environment.
🔔 Don’t forget to follow the daily index level updates for fresh breakouts, reversals, and trend shifts. Let the market guide your trades—not your emotions.
📉 Stock Market Disclaimer
Disclaimer: This post is for informational and educational purposes only and does not constitute financial advice or a recommendation to buy/sell any stock or share. Investing in the stock market involves risk. Past performance is not indicative of future results. Always conduct your own research or consult a licensed financial advisor before making investment decisions.