
Balance Sheet Reading| Balance Sheet Analysis| Assets Liabilities Equity| How to Read Balance Sheet| Strong Balance Sheet| Fundamental Analysis Balance Sheet| Stock Market Balance Sheet
A balance sheet is one of the most powerful yet misunderstood financial statements in the stock market. While many investors focus on share price movements or quarterly profits, the real strength of a company is hidden in its balance sheet. It represents the financial backbone of a business and reveals whether a company is built to last or merely surviving on borrowed strength.
Unlike the Profit & Loss statement, which measures performance over a period, the balance sheet captures a snapshot of financial position at a specific date. It tells us what the company owns, what it owes, and what truly belongs to shareholders. This single statement can explain why some companies survive market crashes while others disappear despite showing profits earlier.
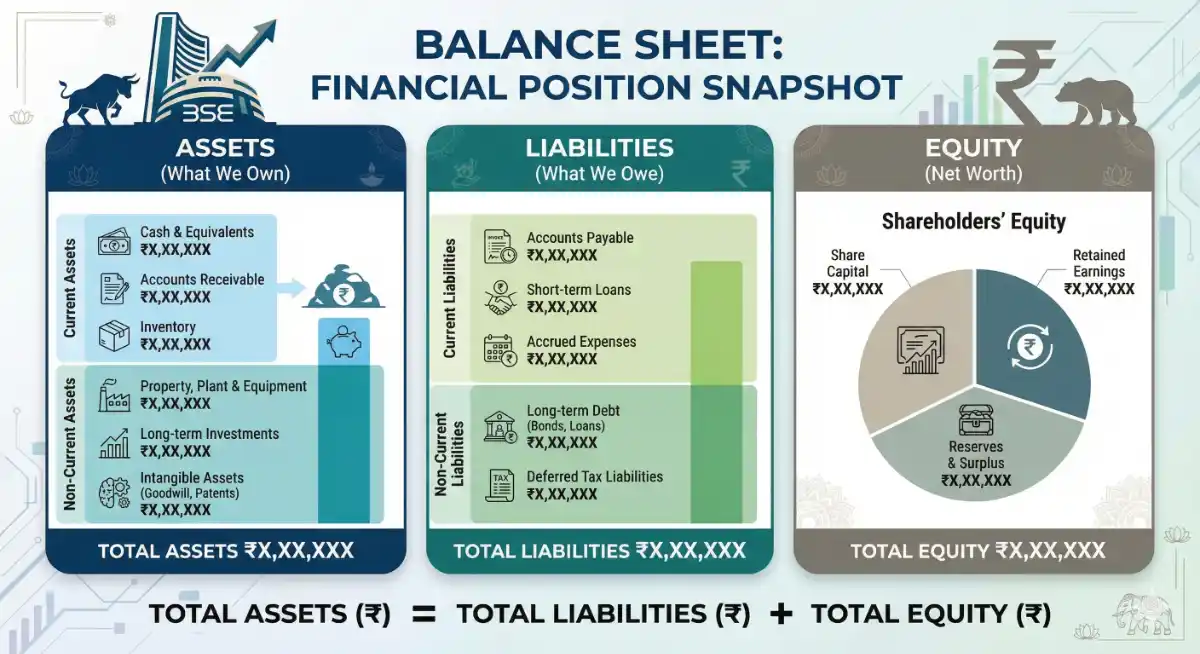
At its core, the balance sheet is governed by one unbreakable rule:
Assets = Liabilities + Equity
This equation reflects financial discipline. Every rupee invested in assets comes either from lenders (liabilities) or owners (equity). There is no shortcut, no exception. Understanding this equation transforms the way one looks at companies—not as stock symbols, but as real businesses.
For long-term investors, the balance sheet is not just a document; it is a risk management tool. A strong balance sheet protects shareholders during economic slowdowns, interest rate hikes, and unexpected crises. A weak balance sheet, on the other hand, can destroy wealth even when profits look attractive on paper.
Also Visit:
- 45 Weeks. 45 Lessons. From Basics to Advanced – Master Stock Market Investing in Less than 1 Year.
- Lesson 1: What is a Stock Market? Beginner’s Guide to Understanding Shares & Trading
- Lesson 13: Intraday vs Delivery. What trade to do!
- Lesson 14: Short Selling & Margin Trading
- Lesson 15: Settlement System: How Your Trade Becomes Real Money and Shares
- Lesson 16: Introduction: Understanding the Balance Sheet Analysis!
📊 Types of Balance Sheet
Before diving into numbers, it is important to understand the different forms in which balance sheets are presented.
1️⃣ Classified Balance Sheet
A classified balance sheet separates assets and liabilities into current and non-current categories. This structure makes it easier to judge liquidity, solvency, and financial stability at a glance.
Example:
Most listed companies in India publish classified balance sheets in their annual and quarterly reports.
2️⃣ Comparative Balance Sheet
A comparative balance sheet shows data for multiple years side by side. This format helps track trends such as increasing debt, improving cash position, or expansion of assets.
Example:
If assets grow steadily while liabilities remain controlled over five years, it indicates disciplined growth.
3️⃣ Consolidated Balance Sheet
This balance sheet combines the financial position of a parent company and its subsidiaries. It gives a holistic picture of the entire business group.
Example:
Large corporate groups with multiple businesses use consolidated balance sheets to reflect true financial strength.
🧾 Main Components of a Balance Sheet
A balance sheet is divided into three major sections:
- Assets – What the company owns
- Liabilities – What the company owes
- Equity – What belongs to shareholders
Each of these sections tells a unique story. Let us explore them one by one in depth.
🏗️ Assets: What the Company Owns
Assets are economic resources controlled by the company. They help generate revenue, support operations, and create future value. Assets are not just numbers—they represent factories, brands, cash, and growth potential.
🔹 Current Assets
Explanation:
Current assets are assets expected to be converted into cash within one year. These assets are critical for daily business operations and short-term financial health. Cash, bank balances, inventory, receivables, and short-term investments fall under this category.
A company with strong current assets can easily pay suppliers, salaries, and taxes without stress. High liquidity also protects the business during sudden downturns or revenue disruptions.
From an investor’s perspective, current assets act as a financial cushion.
Example:
If a company holds ₹1,000 crore in current assets and only ₹400 crore in short-term obligations, it has a comfortable liquidity position and lower operational risk.
🔹 Non-Current Assets
Explanation:
Non-current assets are long-term assets used in the business for several years. These include land, buildings, machinery, equipment, and intangible assets like brands, patents, and software.
These assets reflect the company’s long-term vision and capacity to grow. Expansion of non-current assets usually signals investment in future production, technology, or infrastructure.
However, investors must also evaluate whether these assets are productive or merely increasing depreciation costs.
Example:
A manufacturing company building a new plant increases fixed assets today but aims to increase revenue and profits in the coming years.
💳 Liabilities: What the Company Owes
Liabilities represent financial obligations that the company must repay. Debt itself is not harmful, but unmanaged debt can destroy even profitable businesses.
🔹 Current Liabilities
Explanation:
Current liabilities are obligations payable within one year. These include trade payables, short-term loans, outstanding expenses, and taxes payable.
Healthy businesses maintain a balance between current assets and current liabilities. Problems arise when short-term liabilities exceed the company’s ability to pay them comfortably.
This section is crucial for assessing liquidity risk.
Example:
If a company’s current liabilities rise sharply without a matching increase in current assets, it may face cash flow stress.
🔹 Non-Current Liabilities
Explanation:
Non-current liabilities are long-term obligations payable after one year. These include long-term loans, bonds, debentures, and lease liabilities.
Long-term debt is often used for expansion and capital investment. While it can boost growth, excessive long-term debt increases interest burden and financial risk.
Investors closely watch whether profits and cash flows are strong enough to service this debt.
Example:
Infrastructure companies often carry heavy long-term debt, but stable cash flows make it manageable.
🏦 Equity: Shareholders’ Ownership
Explanation:
Equity represents the owners’ stake in the business. It includes share capital and reserves generated from retained profits. Equity is the true net worth of the company.
Rising equity over time indicates that the company is generating profits and reinvesting them effectively. Declining or negative equity is a major warning sign.
For long-term investors, equity growth is a direct indicator of wealth creation.
Example:
A company that grows equity consistently over a decade usually rewards shareholders through price appreciation.
📊 Balance Sheet Ratios That Matter
Explanation:
Raw numbers become powerful insights when converted into ratios. These ratios help compare companies across sectors and time periods.
- Debt-to-Equity Ratio: Measures financial leverage
- Current Ratio: Measures short-term liquidity
- Net Worth Growth: Reflects long-term strength
Example:
Two companies may earn the same profit, but the one with lower debt and higher equity is generally safer.
🚩 Balance Sheet Red Flags
Explanation:
A balance sheet often reveals trouble long before it appears in the share price. Rising debt, falling cash, negative reserves, and frequent equity dilution are strong warning signals.
Ignoring these signs can lead to heavy losses.
Example:
Many companies collapse not because of losses, but because they fail to manage debt obligations.
🧩 How Balance Sheet Connects with Long-Term Investing
A strong balance sheet allows companies to survive recessions, invest during downturns, and outperform competitors over time. Weak balance sheets limit flexibility and increase dependence on external funding.
This is why seasoned investors always prioritize balance sheet strength over short-term profits.
✨ Final Summary: Why Balance Sheet Reading Is Non-Negotiable
- Balance sheet shows financial stability, not just profitability
- Assets represent ownership and capacity
- Liabilities represent obligations and risk
- Equity reflects shareholders’ real value
- Strong balance sheet builds long-term wealth
Q1. Why is the balance sheet more important than the Profit & Loss statement?
The Profit & Loss statement shows how much a company earned during a period, but the balance sheet shows whether the company is financially strong enough to survive. A company can report profits while still being burdened with heavy debt or poor liquidity. The balance sheet reveals the real financial condition by showing assets, liabilities, and equity at a specific point in time.
Example:
Two companies report the same profit, but one has high debt and low cash. The balance sheet helps identify which company is safer for long-term investment.
Q2. What indicates a strong balance sheet in simple terms?
A strong balance sheet usually has:
- Low or manageable debt
- High cash and liquid assets
- Growing equity and reserves
- Healthy relationship between assets and liabilities
Such companies are better positioned to handle market downturns and economic uncertainty.
Example:
Companies with high cash reserves often continue operations smoothly even during recessions.
Q3. Is having debt always bad for a company?
No, debt is not always bad. Debt can help companies expand faster and improve returns. The problem arises when debt becomes too high compared to equity and cash flows. Balanced and well-managed debt is healthy, while excessive debt increases financial risk.
Example:
Capital-intensive industries often use long-term loans to build infrastructure, but they must ensure steady cash flows to service the debt.
Q4. How often should investors check a company’s balance sheet?
Investors should review the balance sheet at least once every quarter and in detail during annual results. Long-term investors often compare balance sheets over multiple years to understand trends rather than focusing on a single year.
Example:
Tracking debt and equity growth over five years gives a clearer picture than looking at just one year.
Q5. What is more important: assets growth or equity growth?
Both are important, but equity growth is more meaningful. Assets can increase due to borrowing, but equity grows mainly through retained profits. Sustainable equity growth indicates genuine wealth creation.
Example:
If assets rise sharply but equity remains flat, it may indicate heavy borrowing.
Q6. Can a company have negative equity? What does it mean?
Yes, a company can have negative equity when liabilities exceed assets. This is a serious warning sign and often indicates financial distress. Such companies are considered high-risk investments.
Example:
Companies with continuous losses and heavy debt may show negative net worth on their balance sheet.
Q7. Why do investors compare balance sheets of multiple years?
Comparing balance sheets across years helps identify financial trends—whether the company is improving, stagnating, or weakening. Trends matter more than one-time numbers.
Example:
A gradual reduction in debt over five years is a positive signal, even if profits fluctuate.
Q8. How does a balance sheet help during market crashes?
During market crashes, companies with strong balance sheets can survive longer, raise funds easily, and even acquire weaker competitors. Weak balance sheet companies often struggle or shut down.
Example:
During economic slowdowns, cash-rich companies often emerge stronger.
Q9. Are balance sheet numbers enough to decide an investment?
No, the balance sheet should be analyzed along with the Profit & Loss statement and Cash Flow statement. Together, they provide a complete picture of profitability, liquidity, and stability.
Example:
A company with a strong balance sheet but declining profits still needs deeper analysis.
Q10. What is the biggest mistake investors make while reading balance sheets?
The biggest mistake is focusing only on profits and ignoring debt and cash position. Another common error is not comparing balance sheets over time.
Example:
Many investors invest in high-profit companies without noticing rising debt levels, which later leads to losses.
📌 Final Thought:
If you understand the balance sheet, you understand the risk behind the return. Profits attract attention, but balance sheets protect capital.
Balance Sheet Reading| Balance Sheet Analysis| Assets Liabilities Equity| How to Read Balance Sheet| Strong Balance Sheet| Fundamental Analysis Balance Sheet| Stock Market Balance Sheet
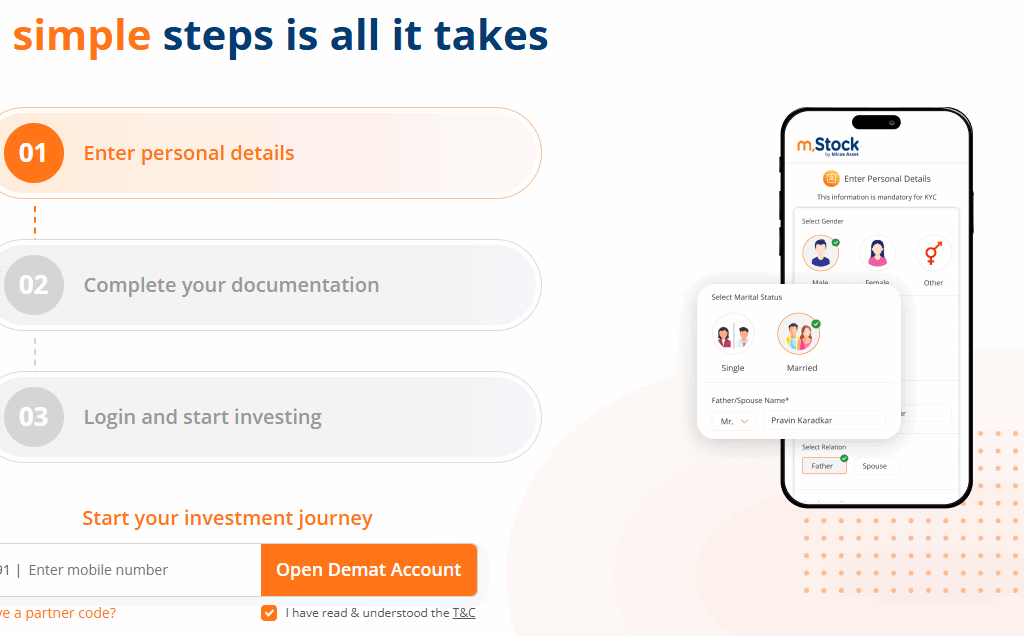
📌 Final Affiliate CTA
Start trading with professional order types, GTT automation and Mini brokerage
👉Open Your mStock Demat Account: Click Here
Also Visit:
- 45 Weeks. 45 Lessons. From Basics to Advanced – Master Stock Market Investing in Less than 1 Year.
- Lesson 1: What is a Stock Market? Beginner’s Guide to Understanding Shares & Trading
- Lesson 13: Intraday vs Delivery. What trade to do!
- Lesson 14: Short Selling & Margin Trading
- Lesson 15: Settlement System: How Your Trade Becomes Real Money and Shares
- Lesson 16: Introduction: Understanding the Balance Sheet Analysis!
Course Introduction:
Open Demat Account
by Mirae Asset (m,Stock)

-
Trading Alert: Indian Stock Market Holidays on March 31 and Good Friday 2026
Stock Market Holidays 2026| NSE Holiday List| BSE Holidays| Mahavir Jayanti 2026| Good Friday 2026| Trading Calendar India| Share Market…
-
Nifty 50 and Sensex Post-Bloodbath Analysis: Recovery or Trap?
Nifty 50 Prediction Tomorrow| Sensex Analysis March 2026| Indian Stock Market Recovery| Stock Market Bloodbath Reasons The Indian stock market…
-
Stock Market Bloodbath 2026: 10 Rules to Protect Your Wealth
Stock Market Bloodbath 2026| Market Crash Strategy| Portfolio Recovery Tips| Investing in Volatile Markets Critical Event Status / Date Market…