
Technical Analysis| Technical Analysis in Stock Market| Chart Analysis for Beginners| Stock Market Charts Guide| Price Action Trading| Trend Analysis Stocks
“Technical Analysis helps traders study price and volume data to predict market trends.”
💡 Learning Outcome: Understand why traders use charts
🎯 Key Takeaway: Technical Analysis helps predict market sentiment
🔥 Introduction
After learning valuation techniques, you now understand how to identify strong companies. But knowing a good company is not enough in the stock market. The real challenge is timing — knowing when to buy and when to sell.
Many investors make mistakes here. They buy good stocks at the wrong time and end up in losses or miss profitable opportunities. This is where technical analysis becomes important.
Technical analysis focuses on market behavior rather than company fundamentals. It studies price movement, volume, and trends to help traders make better decisions.
Instead of asking whether a company is good or bad, technical analysis answers a different question — is this the right time to enter or exit?
This approach is widely used by traders because markets move continuously, and quick decisions are required. Charts and patterns help in understanding how buyers and sellers are behaving.
Once you understand technical analysis, your perspective changes. You stop reacting emotionally to market movements and start making decisions based on logic and patterns.
🧠 What is Technical Analysis
Technical analysis is the study of price movements and trading activity to predict future market direction. It focuses on historical data such as price and volume to understand how the market behaves.
The basic idea behind technical analysis is that price movements are not random. They follow patterns and trends influenced by human psychology, such as fear and greed.
Instead of analyzing company financials, technical analysis looks at charts. These charts show how the price has moved over time and help identify patterns that may repeat in the future.
Technical analysis is based on probability, not certainty. It does not guarantee outcomes but helps traders make informed decisions with better chances of success.
It is widely used for:
- Identifying entry and exit points
- Understanding market trends
- Managing risk
By studying past behavior, traders try to anticipate future movements. This makes technical analysis a powerful tool for decision-making in fast-moving markets.
📊 Why Traders Use Technical Analysis
Traders use technical analysis because it provides a practical way to make decisions in real time. Markets move quickly, and waiting for fundamental data is not always possible.
Technical analysis helps traders understand:
- Whether a stock is in an uptrend or downtrend
- When momentum is strong or weakening
- Where buying or selling pressure exists
It allows traders to identify opportunities based on price behavior rather than assumptions.
One of the biggest advantages is timing. Even if you select a strong company, entering at the wrong time can lead to losses. Technical analysis helps improve timing and reduces unnecessary risk.
It is especially useful for:
- Intraday trading
- Swing trading
- Short-term strategies
Technical analysis also reflects market sentiment. A sudden increase in price or volume often indicates strong interest from buyers or sellers.
For traders, it acts as a guide that helps them react to market movements rather than guess them.
⚖️ Technical Analysis vs Fundamental Analysis
Technical analysis and fundamental analysis are two different approaches used in the stock market. Both are important but serve different purposes.
Fundamental analysis focuses on the company itself. It studies financial statements, earnings, growth, and business performance. It is mainly used for long-term investing.
Technical analysis, on the other hand, focuses on price movement. It studies charts, patterns, and trends to understand market behavior. It is mainly used for timing decisions.
The difference can be understood simply:
Fundamental analysis tells you what to buy.
Technical analysis tells you when to buy.
Smart investors combine both approaches. They use fundamentals to identify strong companies and technical analysis to decide the right entry and exit points.
This combination improves decision-making and increases the chances of success in the market.
📉 Core Assumptions of Technical Analysis
Technical analysis is based on a few important principles that guide how traders interpret charts and market data.
The first assumption is that the market reflects all available information. This means that everything — news, results, events — is already included in the price.
The second assumption is that prices move in trends. Stocks do not move randomly; they follow patterns such as upward trends, downward trends, or sideways movement.
The third assumption is that history repeats itself. Market movements are influenced by human behavior, and since human emotions do not change, similar patterns tend to appear again.
These assumptions form the foundation of all technical strategies. They help traders understand that price movement is not chaotic but follows certain behaviors.
📊 Key Components of Technical Analysis
Technical analysis is built on three main elements that help traders understand market behavior.
The first is price. Price is the most important factor because it reflects everything happening in the market. All decisions are ultimately based on price movement.
The second is volume. Volume shows how many shares are being traded. High volume usually indicates strong interest, while low volume suggests weak participation.
The third is charts. Charts are visual representations of price movement over time. They help traders identify trends, patterns, and signals quickly.
Together, these components give a complete picture of market activity. By analyzing price, volume, and charts, traders can make more informed decisions.
📈 Types of Charts
Charts are the foundation of technical analysis. They provide a visual way to understand how prices move over time.
A line chart is the simplest form. It connects closing prices and gives a basic view of trend direction. It is useful for beginners.
A bar chart provides more detail by showing opening, closing, high, and low prices. It helps traders understand price range during a specific period.
A candlestick chart is the most popular type. It visually represents price movement using colored candles, making it easier to identify patterns and trends.
Each chart type offers different levels of detail, but all serve the same purpose — helping traders understand market behavior and make better decisions.
🧠 Real Market Perspective
In real market situations, technical analysis helps you think differently.
For example, if a stock has been rising continuously, many investors may rush to buy it. But a technical analyst will first check whether the trend is still strong or if the stock is overextended.
This approach helps avoid emotional decisions. Instead of blindly following the crowd, traders rely on data and patterns.
Technical analysis trains your mind to observe, analyze, and act logically. It helps you stay disciplined even during volatile market conditions.
💡 Practical Beginner Strategy
A simple approach to start using technical analysis is to follow a structured method.
First, identify the trend. Check whether the stock is moving upward, downward, or sideways.
Second, find a suitable entry point. Look for levels where the price shows strength or support.
Third, plan your exit. Decide in advance when to book profit or cut losses.
This structured approach helps reduce confusion and improves decision-making. It also builds discipline, which is essential for success in trading.
🧠 Golden Rule
Trend is your best friend.
Following the trend increases the probability of success. Going against the trend without proper confirmation can lead to losses.
🧠 Final Summary
Technical analysis is a skill that develops with practice. It is not about predicting the market perfectly but about understanding how it behaves.
It focuses on price, volume, and patterns to help traders make better decisions. It complements fundamental analysis by improving timing.
Once you start using technical analysis, charts become more than just lines. They become a reflection of market psychology.
This lesson marks the beginning of your journey into understanding how markets move and how traders think.
❓ FAQs
What is technical analysis in simple terms
It is the study of price and charts to predict future market movement
Is technical analysis useful for beginners
Yes, it helps understand market timing and behavior
Can technical analysis guarantee profits
No, it works on probability, not certainty
Should I use both technical and fundamental analysis
Yes, combining both gives better results
🔥 Closing Line
Charts don’t predict the future… they reveal how the market is thinking
Technical Analysis| Technical Analysis in Stock Market| Chart Analysis for Beginners| Stock Market Charts Guide| Price Action Trading| Trend Analysis Stocks
📌 Final Affiliate CTA
Start trading with professional order types, GTT automation and Mini brokerage
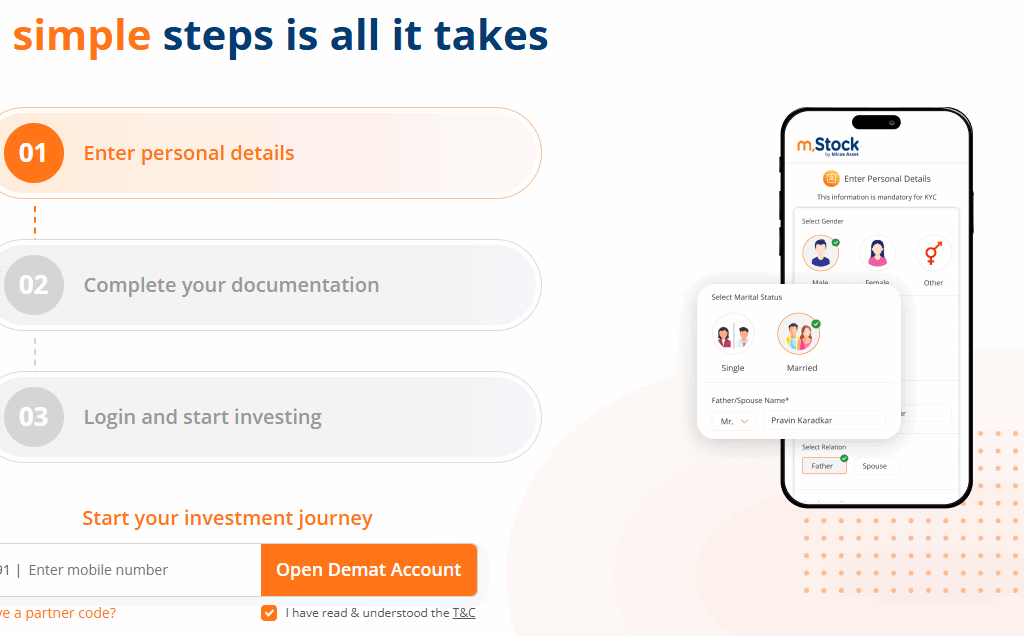
👉Open Your mStock Demat Account: Click Here
Course Introduction:
Open Demat Account
by Mirae Asset (m,Stock)

-
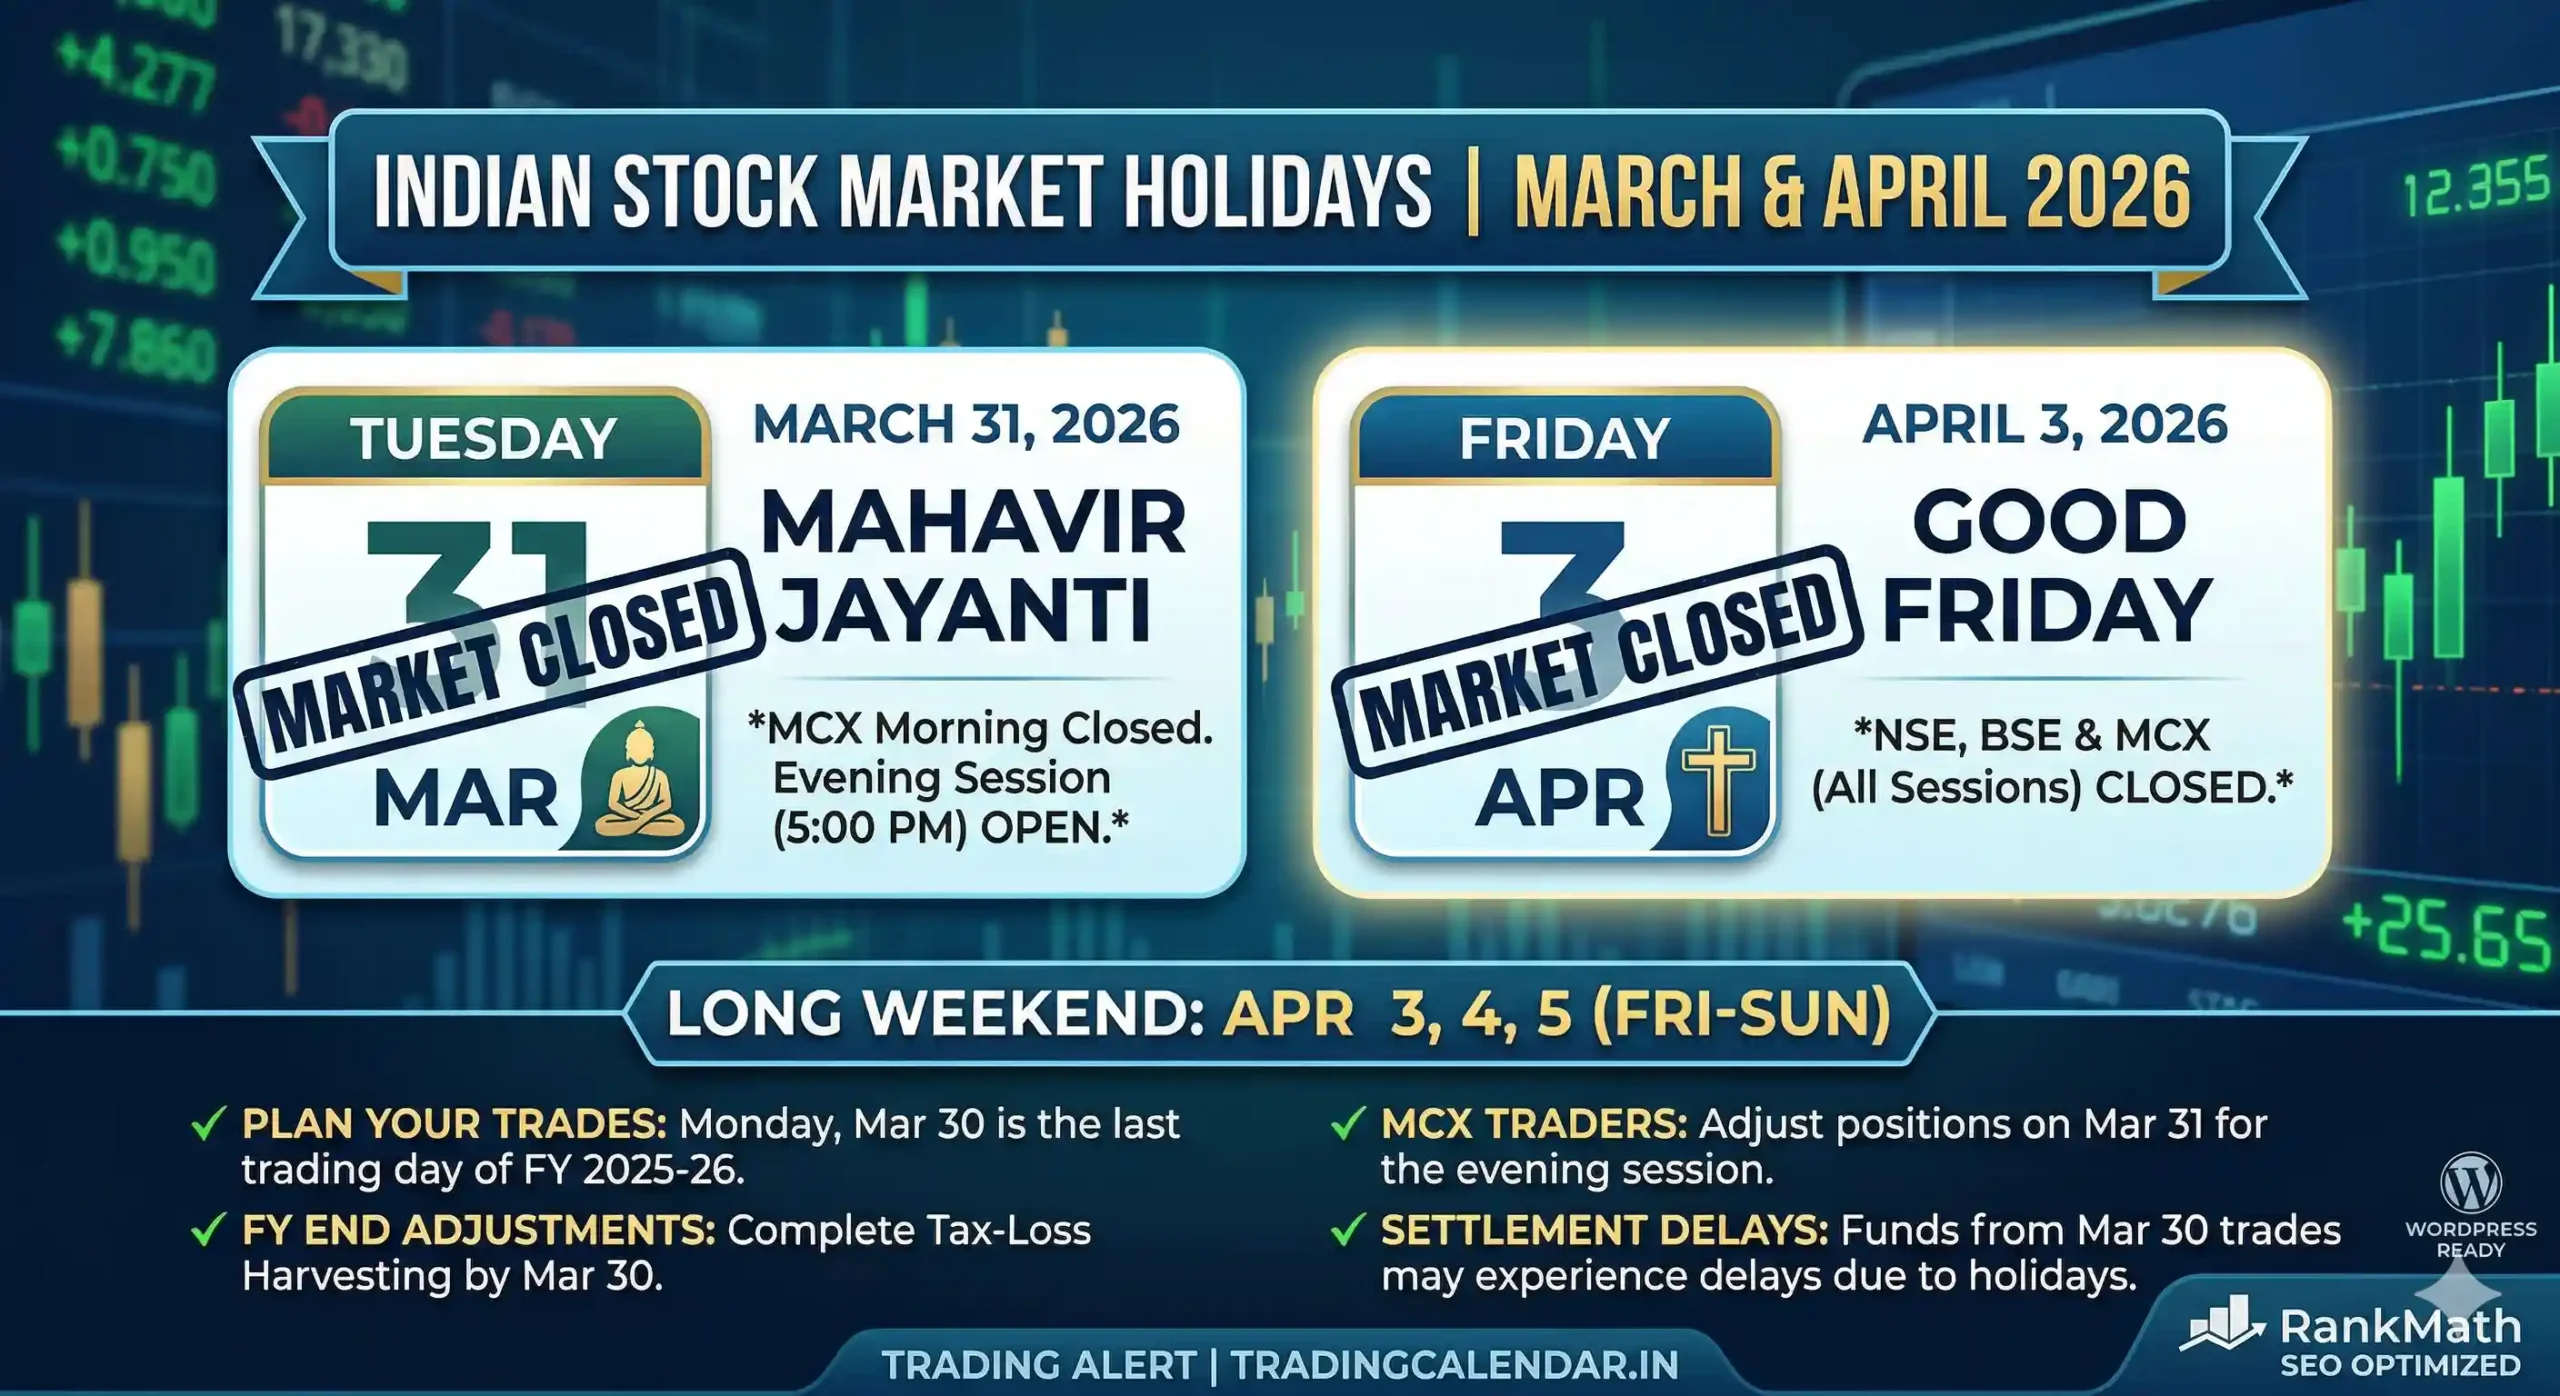
Trading Alert: Indian Stock Market Holidays on March 31 and Good Friday 2026
Stock Market Holidays 2026| NSE Holiday List| BSE Holidays| Mahavir Jayanti 2026| Good Friday 2026| Trading Calendar India| Share Market News| NSE Closed Dates| Indian Stock Market. Critical Dates & Holiday Schedule Event Date Day Market Status Mahavir Jayanti March 31, 2026 Tuesday Closed Annual Bank Closing April 01, 2026 Wednesday Open (Settlement Holiday) Good…
-
Nifty 50 and Sensex Post-Bloodbath Analysis: Recovery or Trap?
Nifty 50 Prediction Tomorrow| Sensex Analysis March 2026| Indian Stock Market Recovery| Stock Market Bloodbath Reasons The Indian stock market recently faced a “Black Monday” on March 23, 2026, where the Sensex plunged nearly 2,000 points and the Nifty 50 tumbled over 600 points. However, the session on Tuesday, March 24, has brought a sigh…
-
Stock Market Bloodbath 2026: 10 Rules to Protect Your Wealth
Stock Market Bloodbath 2026| Market Crash Strategy| Portfolio Recovery Tips| Investing in Volatile Markets Critical Event Status / Date Market Condition Bloodbath / High Volatility Current Trigger Geopolitical Tensions (March 2026) Recovery Signal Awaiting “Green Signal” / De-escalation Investor Action Hold & Stay Away Survival Guide: How to Navigate This Market Bloodbath The screen is…