Nifty Prediction| Market Analysis| Stock Market Tomorrow| Support and Resistance Levels| Gap Up Strategy
The market has shown a sharp recovery from the lows, forming a classic V-shape reversal on the hourly charts. After taking support near the 25,470 zone, the index has climbed back to the critical 25,800 level.
Today’s analysis breaks down the technical chart, identifying the Red Zones (Resistance) and Green Zones (Support) to help you plan your trade for the next session.
Key Market Levels at a Glance
| Level Type | Price Level | Significance |
| Current Market Price | 25,806.10 | Closing / Pivot |
| Immediate Resistance | 25,944.34 | Key Breakout Level |
| Major Resistance | 26,154.46 | Strong Supply Zone |
| Support 1 | 25,730.40 | First Target (Gap Down) |
| Support 2 | 25,650.17 | Second Target |
| Major Support | 25,473.16 | Recent Low / Bottom |
Technical Chart Analysis
Note: The chart above illustrates the recent price action. The Red lines indicate resistance levels where sellers may activate, and Green lines represent support levels where buyers are expected to defend.
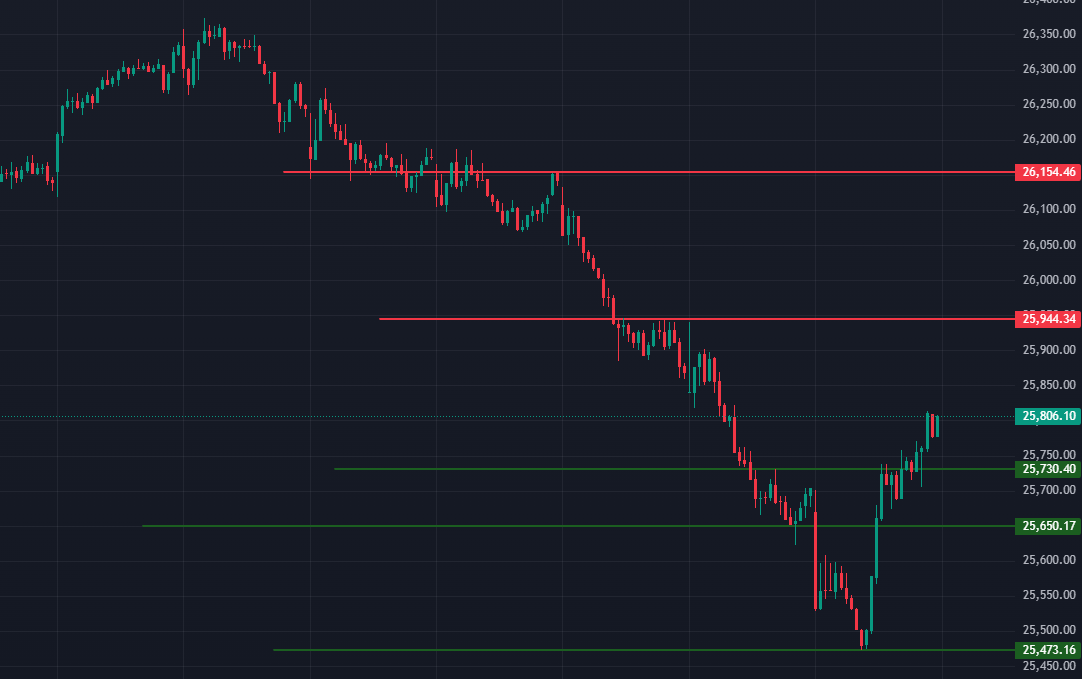
Market Structure
The index recently faced a severe correction, falling from the highs of 26,350 down to 25,473. However, the bulls have stepped in aggressively at the lows, pushing the price back up to the 25,800 zone. The current closing price of 25,806 suggests a battle between the recovery momentum and the overhead supply.
Trading Strategy for Tomorrow
Based on the chart structure and key levels, here is the actionable plan for both Gap Up and Gap Down scenarios.
Scenario 1: The Gap Up Opening
If the market opens Gap Up, the primary focus will be on the 25,800 level.
- The Setup: We need to see if the market can test and hold 25,800 as a support base.
- The Action: If the price sustains above 25,800 after the initial volatility, it signals strength. The bulls will likely aim for the immediate resistance (Red Line) at 25,944.
- Bullish Confirmation: A strong candle close above 25,944 opens the door for a move toward the major resistance at 26,154.
Scenario 2: The Gap Down Opening
If the market opens Gap Down, the bears might try to regain control.
- The Setup: Watch for an opening below the pivot, heading toward Support 1 (25,730).
- Target 1: The first downside objective is 25,730.
- The Critical Decision: If the price hits 25,730 and faces resistance while trying to bounce back (i.e., fails to recover), it confirms weakness.
- Target 2: If the 25,730 level is breached or acts as resistance, the price will likely slide toward Target 2 at 25,650.
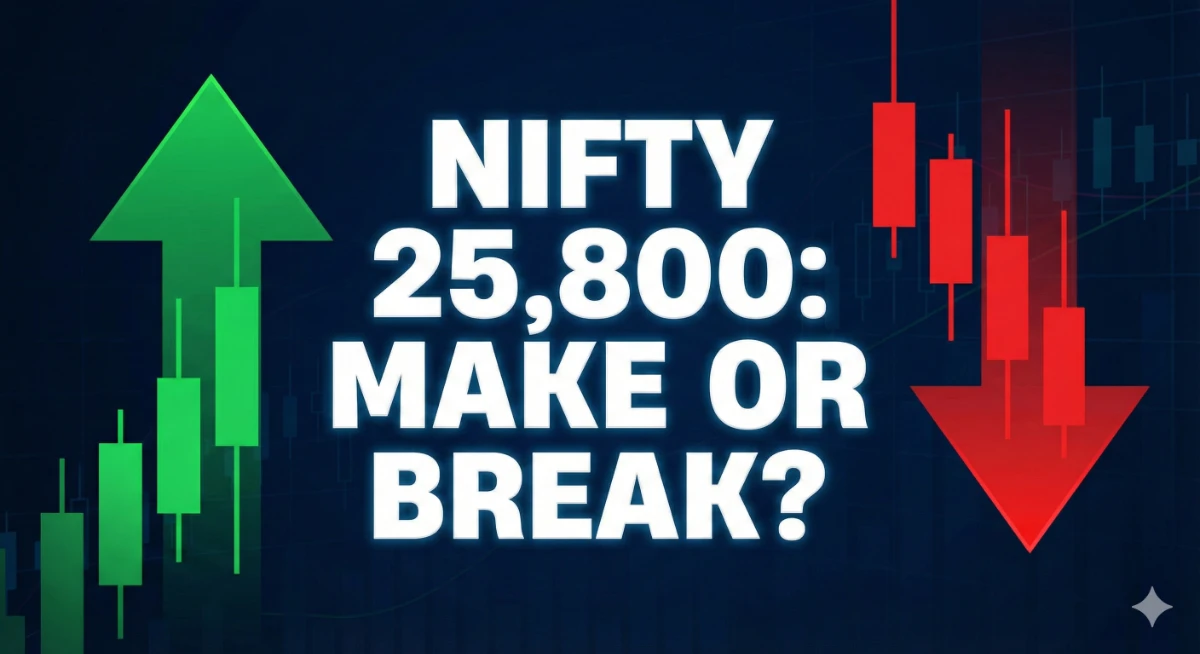
Conclusion
The market is currently at a make-or-break level. The 25,800 zone acts as the pivot. A sustain above this level keeps the recovery alive, while a slip below 25,730 could drag the index back into consolidation. Always trade with strict stop-losses and follow the price action.
FAQ
1. What is the immediate support for Nifty tomorrow?
The immediate support lies at 25,730. If this breaks, the next major support is 25,650.
2. What happens if the market gaps up?
If the market gaps up, it must sustain above 25,800. If it holds this level, the target is 25,944.
3. What do the Red and Green lines on the chart mean?
The Red lines represent Resistance (where price may fall), and the Green lines represent Support (where price may bounce).
Disclaimer: This post is for educational purposes only and does not constitute financial advice. Please consult your financial advisor before trading.
Nifty Prediction| Market Analysis| Stock Market Tomorrow| Support and Resistance Levels| Gap Up Strategy
Also View:
- 45 Weeks. 45 Lessons. From Basics to Advanced – Master Stock Market Investing in Less than 1 Year.
- Lesson 1: What is a Stock Market? Beginner’s Guide to Understanding Shares & Trading
- Lesson 13: Intraday vs Delivery. What trade to do!
- Lesson 14: Short Selling & Margin Trading
- Lesson 15: Settlement System: How Your Trade Becomes Real Money and Shares
- Lesson 16: Introduction: Understanding the Balance Sheet Analysis!
📢 Join Our Market Community
📱 Stay updated on IPOs, Results & Market News:
- WhatsApp Channel: Join Now
- Telegram: Follow Updates
- Arattai: Connect with Us
📌 Stock Market Disclaimer
- Disclaimer: This post is for informational and educational purposes only and does not constitute financial advice or a recommendation to buy/sell any stock or share. Investing in the stock market involves risk. Past performance is not indicative of future results. Always conduct your own research or consult a licensed financial advisor before making investment decisions.
- The information provided on this platform is for educational and informational purposes only. It should not be considered as investment advice, stock recommendations, or financial guidance.
- ⚠️ Stock Market Investments
- Investing in equities, derivatives, mutual funds, and other financial instruments involves market risks, volatility, and the possibility of capital loss.
- Past performance of stocks or indices is not indicative of future returns.
- Always conduct your own research or consult a SEBI-registered financial advisor before making investment decisions.
- ⚠️ IPO (Initial Public Offerings)
- IPO details, issue size, subscription data, and allotment status shared here are based on publicly available information from company filings, stock exchanges, and merchant bankers.
- Investing in IPOs carries risks including listing volatility, business uncertainties, and sector performance dependency.
- Neither acceptance of applications nor allotment guarantees profits. Investors should evaluate their risk appetite before subscribing.
- ⚠️ GMP (Grey Market Premium)
- Grey Market Premium (GMP) is an unofficial and unregulated indicator of expected IPO listing price.
- GMP data is collected from market observers and informal trading circles; it does not have any legal or SEBI recognition.
- GMP values are highly speculative and may differ significantly from actual listing prices. Investors should not rely solely on GMP while taking investment decisions.
- ✅ General Advisory
- We do not provide any buy/sell/hold recommendations.
- Readers and investors are solely responsible for their investment actions and decisions.
- This platform, its authors, and affiliates are not liable for any direct or indirect financial loss arising from the use of this information.
- 🔒 Always invest responsibly and diversify your portfolio.
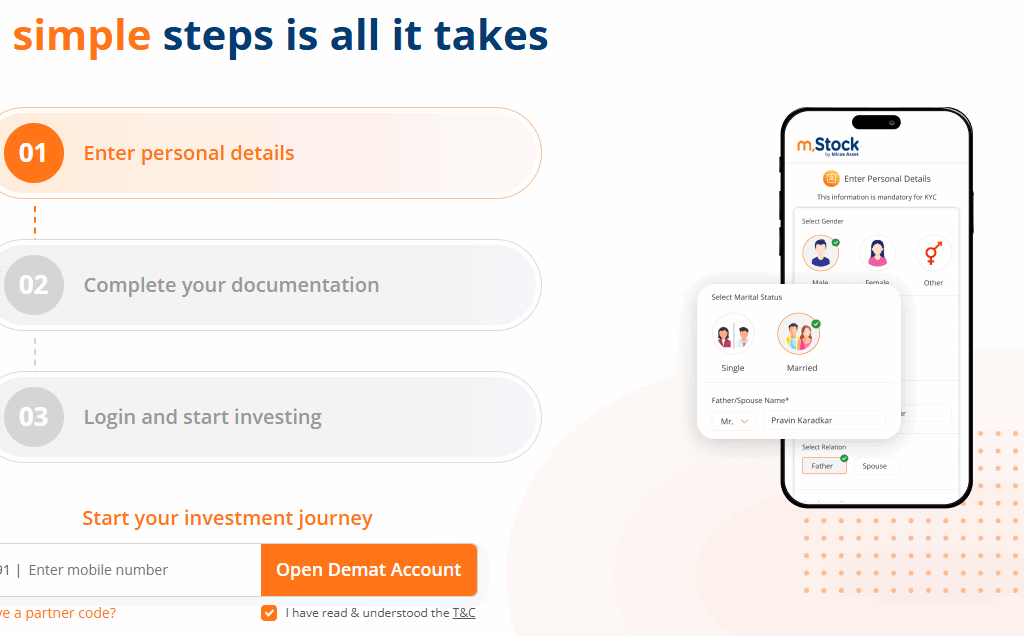
Open Demat Account
by Mirae Asset (m,Stock)

-
Iran-Israel War: Unpacking “Operation Lion’s Roar” and its Ripple Effect on Global Markets – A Deep Dive for Indian Investors
Iran-Israel War Market Impact| Operation Lion’s Roar update| Effect of Iran war on Nifty 50| Crude oil price surge 2026|…
-
The Tariff Tussle: Decoding the Legal Challenge to Executive Trade Power
Supreme Court| Tariffs| Trade War 2026| Donald Trump| IEEPA| Section 301| US Economy| Import Duties| Constitutional Law| Reciprocal Trade Act…
-
The 2025-26 Market Journey: From All-Time Highs to the “Retail Trap” Panic
Indian Stock Market Performance 2025-26| Nifty 50 Returns FY26| Why is Market Falling Feb 2026| Hold or Sell Indian Stocks|…
-
Indian Stock Market Update Feb 20: Nifty Reclaims 25,550, Sensex Jumps 316 Pts Amid Global Cues
Indian Stock Market Update Feb 20| Nifty 50 today| Sensex closing| Top gainers and losers Market Snapshot: The Bulls Fight…
-
Indian Stock Market Today: Bulls Charge Ahead as Sensex and Nifty Rally on Banking & IT Strength
# Indian Stock Market Today: Sensex and Nifty Close Higher Amid Broad-Based Buying ## Indian Stock Market Report – Updated…
-
🚨 YouTube Home Page Error 2026: ‘Something Went Wrong’ – Causes, Fixes & Full Breakdown
🚨 YouTube Home Page Error 2026: ‘Something Went Wrong’ – Causes, Fixes & Full Breakdown Trending Keywords: YouTube down, YouTube…