
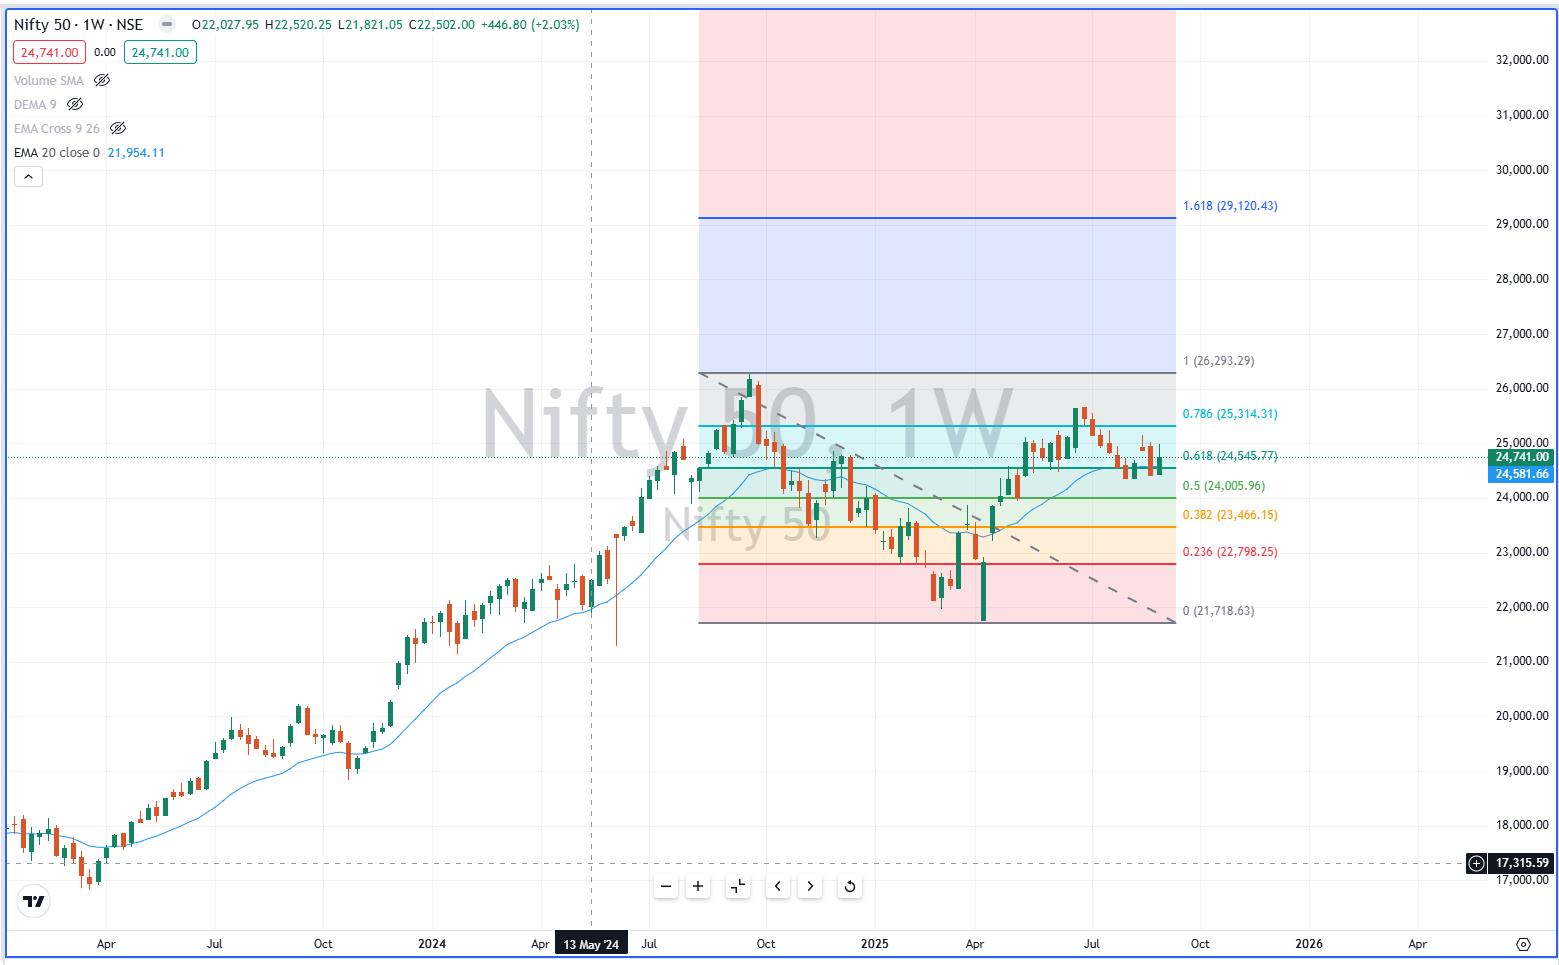
The Nifty 50 index has shown a strong recovery over the past week, signaling renewed buying interest among both institutional and retail investors. Currently trading at 24,741, the index has surged +2.03% (+446.8 points) from its recent low, bouncing from key Fibonacci retracement levels.
Traders are closely monitoring these retracement levels to identify potential support and resistance zones. The use of Fibonacci retracement in weekly analysis helps chartists and investors predict reversal points, manage risks, and plan entry-exit strategies effectively.
This Nifty 50 weekly analysis delves into technical indicators, key support/resistance zones, short-term and long-term outlook, and practical trading guidance.
Key Fibonacci Levels in Focus
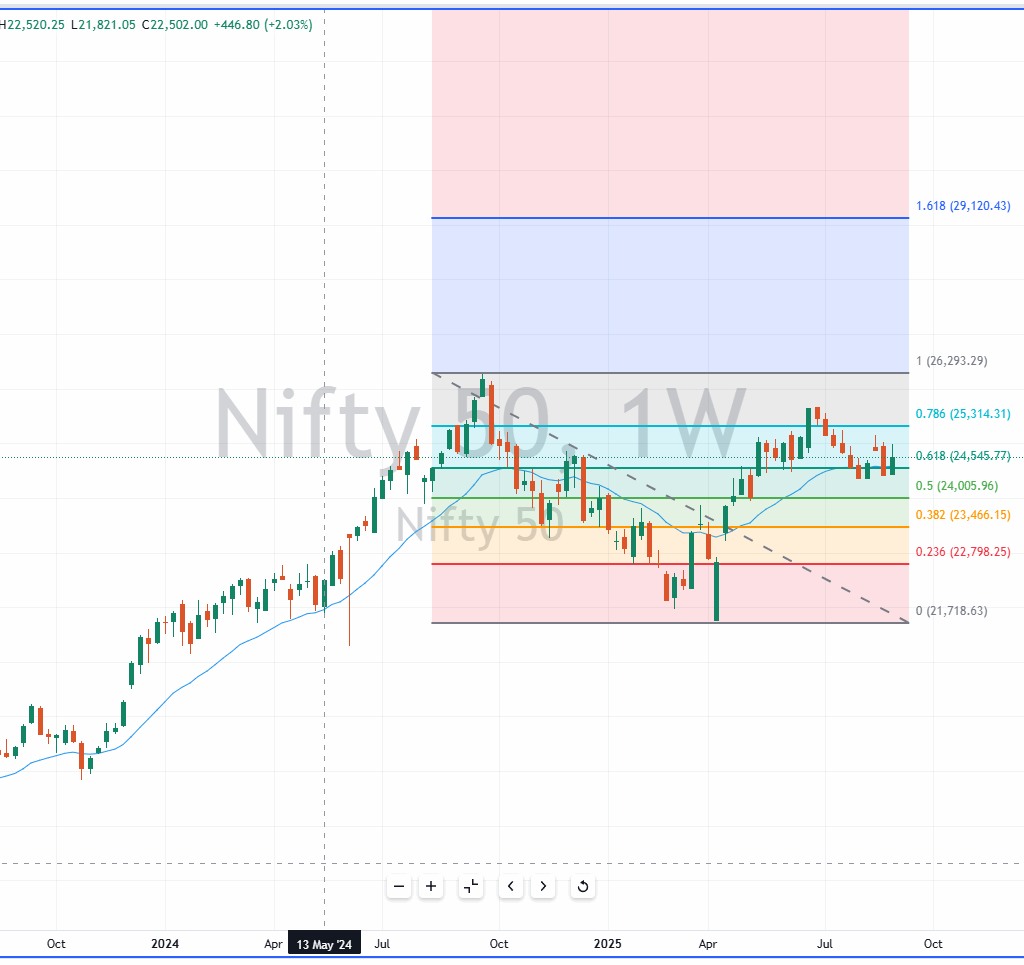
The Fibonacci retracement levels for Nifty 50 are calculated from the swing low of 21,718 to the swing high of 26,293.
1. 0.236 Retracement – 22,798
The 0.236 level acts as the first line of support. A dip to this level may attract buyers and stabilize the index, preventing further downside.
2. 0.382 Retracement – 23,466
This intermediate support often acts as a strong buying zone. A short-term correction to 23,466 can be considered a healthy consolidation within a bullish trend.
3. 0.50 Retracement – 24,005
The 50% retracement level aligns with psychological support. Traders often watch this level for signs of trend continuation or reversal.
4. 0.618 Retracement – 24,545
Currently, the index is hovering near 0.618 retracement, which often serves as a pivotal resistance-support flip. Holding above this level signals short-term bullish momentum.
5. 0.786 Retracement – 25,314
The 0.786 level is a major resistance zone. Traders may book profits near this point, and a break above can propel the index toward the swing high at 26,293.
6. 1.0 Fibonacci – 26,293
This swing high represents strong resistance. The next leg of bullish movement depends on whether the index can breach this level with strong momentum.
7. 1.618 Fibonacci Extension – 29,120
For long-term targets, the 1.618 Fibonacci extension at 29,120 is a potential upside level if the bullish momentum continues over coming months.
Trend Analysis: EMA and Momentum
20-Week EMA – 21,954
The 20-week Exponential Moving Average (EMA) acts as a long-term support. The index remains comfortably above the EMA, indicating that the weekly trend continues to favor bulls.
Momentum Indicators
- RSI (Relative Strength Index): Moderate strength, signaling room for upward movement.
- MACD (Moving Average Convergence Divergence): Positive crossover indicates continued bullish momentum.
Market Bias
The overall market trend remains bullish, with pullbacks being absorbed efficiently. Short-term corrections are healthy and create buying opportunities.
Short-Term Outlook
Bullish Scenario
If the index holds above 24,545, it can target 25,314–26,293. Traders may consider buying on dips above 24,500, with stop-losses placed just below 24,000 to manage risk.
Bearish Scenario
A breakdown below 24,000 could trigger a deeper correction toward 23,466 (0.382 retracement). Further weakness may push the index to 22,798.
Key Price Points for Traders
| Level | Type | Notes |
|---|---|---|
| 25,314 | Resistance | 0.786 retracement, profit booking likely |
| 26,293 | Resistance | Swing high, strong resistance |
| 24,545 | Support/Resistance | 0.618 retracement, pivotal zone |
| 24,005 | Support | 0.50 retracement, psychological support |
| 23,466 | Support | 0.382 retracement, intermediate support |
| 22,798 | Support | 0.236 retracement, first support |
Long-Term Outlook
Sustained weekly closes above 24,500 confirm the bullish trend. The 1.618 Fibonacci extension at 29,120 provides a long-term target.
Factors that may influence the long-term movement:
- Positive domestic economic data
- Institutional inflows and FII participation
- Global cues, including US markets and commodity trends
Market Sentiment & Retail Perspective
- Trend Strength: Strong rebound from 0.618 Fibonacci level confirms bullish sentiment.
- Volatility: Profit booking occurs near resistance levels (25,314–26,293), creating temporary pullbacks.
- Dip Buying Opportunity: Corrections to 24,000–23,500 may serve as ideal accumulation zones for long-term investors.
Trading Strategy & Recommendations
- Aggressive Traders: Enter near current levels (24,741), target 25,314–26,293, stop-loss below 24,500.
- Conservative Traders: Wait for breakout above 25,314 before taking positions, targeting swing high 26,293.
- Long-Term Investors: Use dips near 24,000–23,500 to accumulate for potential upside toward 29,120.
Tip: Always maintain stops near critical Fibonacci levels to manage risk.
Conclusion
- Current Level: 24,741, above 0.618 Fibonacci → bullish short-term momentum
- Support Zones: 24,545, 24,005, 23,466, 22,798
- Resistance Zones: 25,314, 26,293
- EMA Support: 20-week EMA at 21,954
- Trend: Bullish above 24,500
- Long-Term Target: 29,120
Traders should watch for rejection near 25,300–26,300, while dips toward 24,000–23,500 may be used as accumulation opportunities.
📌 Stock Market Disclaimer
- Disclaimer: This post is for informational and educational purposes only and does not constitute financial advice or a recommendation to buy/sell any stock or share. Investing in the stock market involves risk. Past performance is not indicative of future results. Always conduct your own research or consult a licensed financial advisor before making investment decisions.
- The information provided on this platform is for educational and informational purposes only. It should not be considered as investment advice, stock recommendations, or financial guidance.
- ⚠️ Stock Market Investments
- Investing in equities, derivatives, mutual funds, and other financial instruments involves market risks, volatility, and the possibility of capital loss.
- Past performance of stocks or indices is not indicative of future returns.
- Always conduct your own research or consult a SEBI-registered financial advisor before making investment decisions.
- ⚠️ IPO (Initial Public Offerings)
- IPO details, issue size, subscription data, and allotment status shared here are based on publicly available information from company filings, stock exchanges, and merchant bankers.
- Investing in IPOs carries risks including listing volatility, business uncertainties, and sector performance dependency.
- Neither acceptance of applications nor allotment guarantees profits. Investors should evaluate their risk appetite before subscribing.
- ⚠️ GMP (Grey Market Premium)
- Grey Market Premium (GMP) is an unofficial and unregulated indicator of expected IPO listing price.
- GMP data is collected from market observers and informal trading circles; it does not have any legal or SEBI recognition.
- GMP values are highly speculative and may differ significantly from actual listing prices. Investors should not rely solely on GMP while taking investment decisions.
- ✅ General Advisory
- We do not provide any buy/sell/hold recommendations.
- Readers and investors are solely responsible for their investment actions and decisions.
- This platform, its authors, and affiliates are not liable for any direct or indirect financial loss arising from the use of this information.
- 🔒 Always invest responsibly and diversify your portfolio.
Open Demat Account
by Mirae Asset (m,Stock)