
Index Overview: Nifty 50’s Critical Turning Point
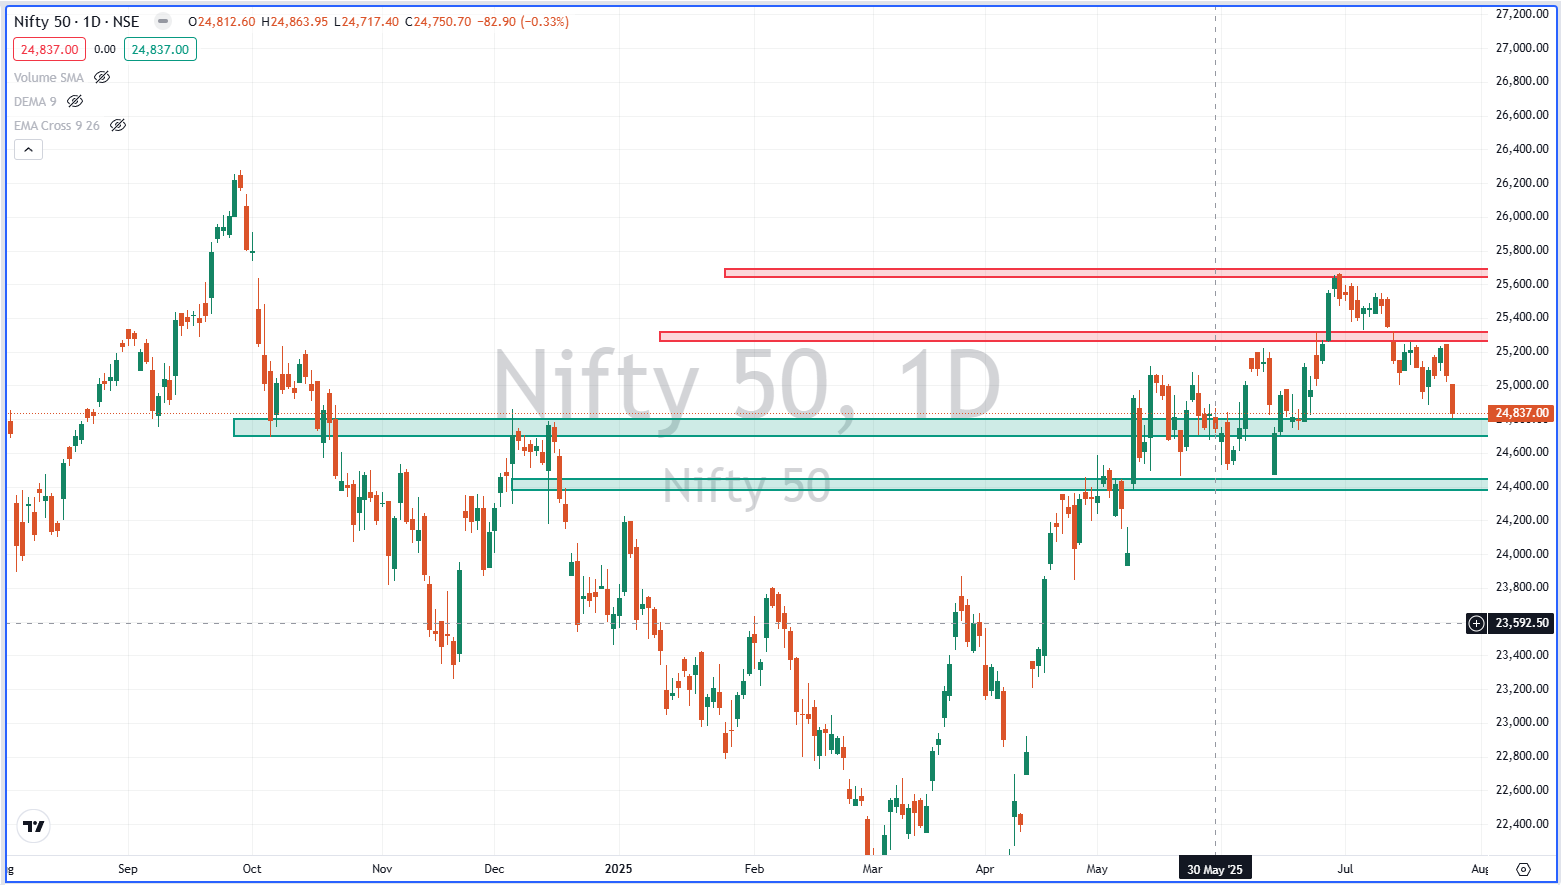
As of 21 July 2025, the Nifty 50 has once again approached a crucial support zone of 24,800, after witnessing consistent rejection from higher levels near 25,550–25,800. This technical level has now become a battleground between bulls and bears. The recent price action and candlestick behavior are hinting at rising selling pressure, with the index entering a short-term consolidation or even a possible downward breakout.
With the broader structure indicating a distribution pattern, it’s essential to analyze the upcoming movement from a support-resistance and price action point of view. Let’s dive deep into what the chart is telling us.
🧭 Key Levels to Watch (Support & Resistance)
| Type | Price Zone | Significance |
|---|---|---|
| 🔻 Resistance 1 | 25,200 – 25,300 | Immediate resistance post rejection |
| 🔻 Resistance 2 | 25,550 – 25,800 | Strong supply zone; recent highs |
| 🟢 Support 1 | 24,800 | Immediate & psychological support |
| 🟢 Support 2 | 24,600 – 24,400 | Historical buying zone; breakdown if breached |
| ⚠️ Breakdown Point | Below 24,400 | Trend reversal & deeper correction likely |
📉 Current Price Structure – Bearish Setup in Progress?
❗ Price Behavior:
-
The index formed multiple red candles, showing rejection at upper resistance.
-
It is trading below short-term moving averages on lower timeframes
-
There’s a visible lower high structure, suggesting a short-term downtrend.
❗ Chart Patterns Noticed:
-
Double Top like formation near 25,800
-
Descending channel formation from July highs
-
Support retest at 24,800 (currently under threat)
These technical factors are increasing the possibility of a breakdown below 24,800, which may trigger further selling pressure, especially from FIIs or short-term institutional traders.
🧠 What This Means for the Market?
If 24,800 fails to hold, it could result in:
-
A quick move toward 24,600, which previously acted as strong support.
-
If 24,600 also cracks, then 24,400 becomes the line of last defense for bulls.
-
On the flip side, any reversal above 25,050 must be accompanied by strong volume and bullish candlestick reversal — else it will be short-lived.
📅 Next Day Movement Projection – 28 July 2025
🔽 Bearish Scenario – Most Likely:
-
A break and close below 24,800 may drag Nifty toward:
-
📍 First Target: 24,600
-
📍 Second Target: 24,400
-
Probability: 65%
Bias: Bearish
Action: Short below 24,800 with SL above 25,000
🔁 Range-Bound Bounce – Neutral Case:
-
If 24,800 holds, expect a sideways bounce up to:
-
📍 Resistance: 25,050 – 25,100
-
Probability: 25%
Bias: Sideways
Action: Avoid fresh positions; consider intraday range trades.
🔼 Bullish Reversal – Least Likely:
-
Only on break above 25,200 with volume, Nifty may aim for:
-
📍 25,500 and eventually 25,800 (very unlikely without news trigger)
-
Probability: 10%
Bias: Reversal
Action: Wait-and-watch; confirm breakout with price action.
🧮 Retail Trader Takeaways
✅ If You’re a Swing Trader:
-
Bearish bias remains intact as long as Nifty stays below 25,000.
-
Shorting opportunities may arise below 24,800 with tight stop-losses.
-
No buying until reversal signal above 25,200 is confirmed.
✅ If You’re a Positional Trader:
-
Monitor 24,600 closely – a breakdown below this would indicate short-term trend reversal.
-
Option writers may look at 24,600 PE & 25,200 CE as sell zones for a range-bound week.
✅ If You’re a Day Trader:
-
Use the 24,800 level as your pivot:
-
Below = Short with 24,600 as first target.
-
Hold above = Scalp longs till 25,050.
-
📊 Broader Market Sentiment – Cooling Off Phase
-
Sectoral indices like Bank Nifty, Nifty IT, and Nifty Midcap are showing mixed signals.
-
FIIs have recently turned mild net sellers.
-
VIX remains stable, indicating no panic yet — but complacency near key support is dangerous.
Unless major positive news or earnings surprise come in, the broader market may enter a consolidation-to-correction mode.
🔍 Volume Analysis
-
Recent down days have shown higher-than-average volumes.
-
This indicates that smart money might be exiting or shorting, especially near resistance.
-
No accumulation patterns visible yet near current support levels.
📈 Indicators Watch
| Indicator | Signal (Assumed) | Interpretation |
|---|---|---|
| RSI (Daily) | ~45–50 | Neutral to Bearish |
| MACD | Bearish Crossover (likely) | Momentum losing upside |
| 20-DMA | Flat/Turning Down | Short-term weakness |
| 50-DMA | Below CMP (rising slowly) | Medium-term support at ~24,600 |
💬 Expert Technical View
“The failure to sustain above 25,300 is a red flag. Until Nifty decisively reclaims 25,200+, any upward move will be sold into. Traders must be cautious and avoid aggressive longs near resistance zones.”
📢 What Should You Do?
“Markets are showing signs of caution and possible reversal. Wait for decisive moves. Let price confirm direction — don’t pre-empt. For now, short trades near resistance with defined SLs are safer than aggressive longs.”
Action Plan:
-
Shorting levels: Below 24,800
-
Long trades: Only above 25,200 with confirmation
-
Avoid: No-trade zones (24,850–25,050) – too much chop expected
-
Options Strategy: Iron Condor (24,600 PE – 25,200 CE) for rangebound expiry play
🧲 Final Thoughts
The Nifty 50 is at a make-or-break juncture. If it holds 24,800, there might be a temporary bounce. But if it breaks down, expect a sharper slide toward 24,400. Given the weak candle patterns and inability to scale 25,300, the market is showing classic signs of short-term fatigue.
Traders should stay light, stay alert, and avoid being caught in no-man’s-land.
📉 Stock Market Disclaimer
Disclaimer: This post is for informational and educational purposes only and does not constitute financial advice or a recommendation to buy/sell any stock or share. Investing in the stock market involves risk. Past performance is not indicative of future results. Always conduct your own research or consult a licensed financial advisor before making investment decisions.