💼 Nifty15minChart, BankNiftyAnalysis, SensexLevels, IntradayTrading, June18Outlook, NiftySupportResistance, BankNiftyStrategy, SensexChartAnalysis
📊 Market Summary at a Glance
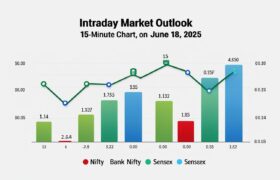
As we gear up for the trading session on June 18, 2025, the Indian equity markets are showing signs of range-bound consolidation, as suggested by the 15-minute chart patterns of Nifty 50, Bank Nifty, and Sensex. Traders are advised to proceed with a cautious yet responsive strategy focused on key support-resistance levels and breakout signals.
📌 Nifty 50 – 15-Minute Chart Insights
Current Status: Market in Range-Bound Zone
-
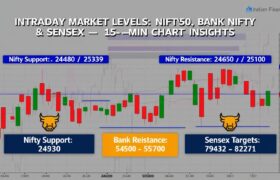
Key Supports:
• 24,670
• 24,550
• 24,465 -
Key Resistances:
• 24,900
• 25,000

-
Technical Outlook:
The Nifty is hovering between 24,465 and 25,000, creating a narrow band of consolidation. This tight range suggests traders should avoid aggressive long or short positions until a confirmed breakout or breakdown is observed. The 24,550–24,670 band is acting as a significant support cluster, while upside movement is getting capped around the 25,000 mark. -
Intraday Strategy Tips:
✅ If Nifty breaks above 25,000 with volume, watch for a momentum move up to 25,200–25,300.
❌ If it breaks down below 24,465, next support lies around 24,250. -
Trader’s Note:
Stay neutral-biased until price action confirms direction. Avoid mid-range entries.
🏦 Bank Nifty – 15-Minute Chart Insights
Volatility Zone Identified: Watch for Breakout!
-
Support Levels:
• 55,400
• 55,147 -
Resistance Levels:
• 56,000
• 56,600

-
Technical Outlook:
Bank Nifty has shown attempts to consolidate near the 55,400–56,000 band. This index remains a key market mover, and with PSU & private banks under watch, a sharp move could be triggered based on macro news or large-cap participation. -
Intraday Strategy Tips:
✅ Watch for a clear breakout above 56,000 for potential long scalps towards 56,400 and 56,600.
❌ Breakdown below 55,147 may attract selling pressure up to 54,800–54,500. -
Retail Trader Takeaway:
Use tight stop-losses and consider option writing strategies if the market remains range-bound. Delta-neutral positions may work best in sideways conditions.
📈 Sensex – 15-Minute Chart Outlook
Flat Momentum but Strong Technical Zones in Play
-
Support Zones:
• 81,500
• 80,500 -
Resistance Zones:
• 82,000
• 82,550

-
Technical Viewpoint:
Sensex mirrors Nifty’s range-bound setup with slightly higher support levels. The 81,500–82,000 region is crucial. A decisive move above 82,550 could spark a fresh uptrend, while a dip below 80,500 could lead to wider correction. -
Intraday Strategy Tips:
✅ Above 82,550 – possible momentum till 83,000.
❌ Below 80,500 – expect intraday dips till 79,800. -
Positional View:
Short-term charts indicate indecisiveness, but bullish bias remains intact above 81,500.
🎯 Trader’s Strategy for June 18, 2025
-
📌 Range Trading with Stop Loss Discipline:
With indices locked in narrow ranges, breakout/breakdown trades are high risk. Stay nimble and avoid over-leveraging. -
📌 Volume-Based Confirmation:
Use volume spikes on 5-minute or 15-minute charts to validate trades near support/resistance. -
📌 Stay Informed:
Be alert to global cues, FII/DII data, and sector rotation, especially in banking and FMCG stocks. -
📌 Tools to Use:
VWAP, Supertrend, and Bollinger Bands work well in range markets to define entry-exit.
📣 Market Sentiment Meter
| Index | Sentiment | Bias |
|---|---|---|
| Nifty 50 | Neutral | Awaiting Breakout |
| Bank Nifty | Slightly Bullish | Above 56,000 Zone |
| Sensex | Neutral | Above 82,000 Key Level |
💬 Final Thoughts
The Indian equity markets are in a pause mode, waiting for triggers. Traders should rely on technical levels, act on confirmation, and avoid premature entries. June 18 could prove to be a consolidation day or a setup for a breakout in the coming sessions.
🧠 Pro Tips for Intraday Traders
-
💡 Patience pays in range-bound markets.
-
💡 Trade light until directional confirmation.
-
💡 Don’t fight the trend – if unclear, stay out.
📌 SEO Meta Description
June 18, 2025 Intraday Market Outlook – Nifty, Bank Nifty & Sensex 15-minute chart analysis with support-resistance levels, trading strategy, and key insights for intraday traders.
📉 Stock Market Disclaimer
Disclaimer: This post is for informational and educational purposes only and does not constitute financial advice or a recommendation to buy/sell any stock or share. Investing in the stock market involves risk. Past performance is not indicative of future results. Always conduct your own research or consult a licensed financial advisor before making investment decisions.