
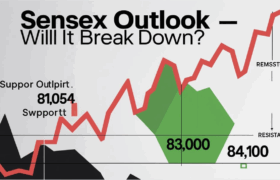
Consolidation or Breakdown? Key Levels to Watch as Bulls Lose Grip
The Indian equity markets continue to showcase choppy behavior, and the Sensex (BSE Index) is no exception. Based on the recent 15-minute time frame, the benchmark index is showing signs of weakness at critical support zones. As of the most recent candle, the Sensex is trading at 83,152.18, marginally lower and sitting precariously at a make-or-break level.
In this report, we analyze the current structure of the Sensex, identify strong support and resistance levels, evaluate the momentum and volume profile, and offer a potential outlook for short-term traders.
📈 Current Market Snapshot:
-
Last traded price: 83,152.18
-
Day high: 83,320.49
-
Day low: 83,260.10
-
Previous Close: 83,190.28
-
Change: -0.00%
-
Timeframe Analyzed: 15-Minute
-
Indicator Reference: EMA Cross (9/26), Volume SMA
🔴 Resistance Levels Observed:
-
Primary Resistance Zone: 83,950 – 84,100
-
This zone has acted as a strong supply region over the last week.
-
Every time price approached this zone, selling pressure emerged.
-
The market failed to sustain above 84,000, indicating bearish sentiment at higher levels.
-
-
Secondary Resistance: 83,300 – 83,400
-
Currently, this is acting as a mid-level resistance.
-
Price repeatedly tested this zone but failed to break convincingly above it.
-
This has formed a lower high pattern, indicating weakening momentum.

Sensex
-
🟢 Support Levels to Watch:
-
Immediate Support Zone: 83,000 – 83,150
-
The price is currently hovering near this crucial support.
-
A breakdown below 83,000 may trigger further selling pressure.
-
-
Medium-Term Support: 82,800 – 82,900
-
This area provided a good base earlier on 2nd July.
-
Buyers stepped in strongly during prior tests of this zone.
-
-
Major Support Zone: 82,300 – 82,500
-
This zone is critical for trend reversal.
-
If this is broken, we might witness a larger correction toward 82,000 or even 81,800.
-
📊 Technical Indicators Analysis:
🔄 EMA Cross (9 & 26)
-
The shorter-term EMA (9) is sloping downward and appears to have crossed below the longer EMA (26) on the 15-minute chart.
-
This bearish crossover suggests a short-term downtrend has emerged.
🔉 Volume Analysis
-
Volume remained weak during upward moves, suggesting a lack of participation from bulls.
-
Sell-offs have seen relatively higher volume spikes—signaling distribution rather than accumulation.
🔁 Price Action & Market Behavior:
The index has formed a clear range-bound structure in the past few trading sessions. The upper range is capped at 84,100, while the lower boundary seems to be forming around 83,000. However, this lower level is now under threat as bears apply pressure near the end of the session.
A head and shoulder pattern is also forming on the intraday chart, with the neckline near 83,100–83,000, reinforcing the possibility of a downside breakout if that level is breached.
Additionally, the formation of lower highs shows waning bullish strength. Price rejection near 83,800 and repeated failures to reclaim the 84,000+ mark adds to this bearish pressure.
🔮 Short-Term Outlook (Next 1–3 Sessions):
🔻 Bearish Bias (if 83,000 breaks)
-
If Sensex breaks below 83,000 with strong volume confirmation, we may see a move towards:
-
82,900
-
82,700
-
Possibly 82,300 as final support.
-
🔼 Bullish Reversal (if 83,300 reclaimed)
-
On the flip side, if bulls manage to reclaim the 83,300–83,400 zone and sustain above it, we may see a test of:
-
83,700
-
83,950–84,100
-
However, the probability currently leans toward the downside given the trend, indicators, and structure.
📌 Key Levels for Traders:
| Action Type | Level Range | Remark |
|---|---|---|
| Strong Resistance | 83,950 – 84,100 | Sellers active, reversal zone |
| Mid Resistance | 83,300 – 83,400 | Previous support turned resistance |
| Pivot Zone | 83,100 – 83,200 | Fight between bulls & bears |
| Immediate Support | 83,000 | Break will trigger fall |
| Key Demand Zone | 82,800 – 82,900 | Buyer interest level |
| Trend Support | 82,300 – 82,500 | Major trendline support |
📣 Trader’s Insight & Strategy:
-
Intraday Traders: Should consider short positions on breakdown below 83,000 with a target near 82,700 and SL at 83,250.
-
Swing Traders: Can look to short on rallies near 83,400–83,500 with SL above 83,700.
-
Positional Traders: Should wait for confirmation below 82,300 or a breakout above 84,100 for trend clarity.
💬 “The market is clearly showing distribution. Patience and disciplined entries are crucial now. Focus on risk management over aggressive trades.”
🧭 Final Verdict: Correction May Extend
The Sensex is showing signs of fatigue after its recent rally. The failure to break above 84,000 and the current pressure on 83,000 support indicates that sellers are gaining control in the short term. If the index closes below this level on the hourly or daily chart, it could confirm a trend reversal or short-term correction.
With global cues mixed and domestic macros holding stable, the index may consolidate before making its next major directional move. Traders are advised to follow key support/resistance levels closely and avoid over-leveraging positions.
Note: This is the Testing Real data may be differ for above
Stock Market Disclaimer
Disclaimer: This post is for informational and educational purposes only and does not constitute financial advice or a recommendation to buy/sell any stock or share. Investing in the stock market involves risk. Past performance is not indicative of future results. Always conduct your own research or consult a licensed financial advisor before making investment decisions.