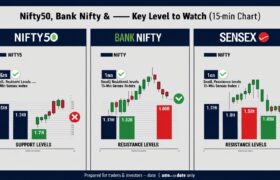
As the markets navigate through macroeconomic uncertainties and shifting investor sentiment, traders and investors are closely watching the charts of major Indian indices — Nifty50, Bank Nifty, and Sensex — for directional clues. Here’s a breakdown of the 15-minute charts for these indices, highlighting crucial support and resistance zones and what market participants should keep an eye on for the short term.
📊 Nifty50 Analysis: Tug of War Between Bulls and Bears
The Nifty50 continues to consolidate within a tight range as volatility picks up ahead of upcoming global cues and domestic earnings announcements. On the 15-minute chart, the index appears to be trading near critical levels that may dictate the direction for the rest of the week.

Support Zones to Watch
-
24777 – This is the immediate support where short-term buyers have previously emerged. A break below this level may invite further selling pressure.
-
24550 – A deeper support that acts as a potential demand zone. Breach of this level could indicate bearish momentum.
Resistance Levels
-
25000 – A psychological level and near-term resistance. Bulls must decisively breach this to regain control.
-
25061, 25110, and 25200 – Layered resistance zones that represent supply pressure. Sustained move above 25200 could trigger a fresh rally.
Market Sentiment & Technical Outlook
Nifty’s structure shows indecision, which could precede a strong move. If the index holds above 24777 and breaches 25000 with volume, momentum traders could pile in for quick upside targets. On the flip side, a close below 24550 might trigger stop-losses and intensify selling.
🏦 Bank Nifty Analysis: Key Test for Financial Sector Strength
Bank Nifty, the index that often leads the broader market, is exhibiting a narrowing range. With financial stocks under the scanner due to mixed Q4 earnings, this chart offers important cues for the upcoming sessions.

Support Levels
-
55200 – First critical support, holding above this level signals stability.
-
54500 – A deeper support zone; breaking below this may result in sharp correction.
Resistance Levels
-
55600 – Initial resistance that aligns with recent intraday highs.
-
55750 and 55850 – Resistance cluster; a breakout here may ignite a rally toward 56000+.
Short-Term Outlook
Bank Nifty seems range-bound, but any breakout from the 55200–55850 zone could provide momentum opportunities. Traders can watch for a decisive move past 55850 to ride short-term bullish sentiment. Alternatively, any weakness below 54500 could lead to panic selling in heavyweights.
📈 Sensex Analysis: Consolidation at Elevated Levels
Sensex, India’s benchmark index, remains above 81000 but is showing signs of fatigue near the upper band. The 15-minute chart suggests the index is at an inflection point.

Support Zones
-
81800 – A short-term floor. Holding above this ensures continuation of the uptrend.
-
81583 – A deeper support and a level to watch for aggressive buying on dips.
Resistance Zones
-
82500 – Resistance where sellers have repeatedly emerged.
-
82721 and 83000 – Key supply zones. A clean break above 83000 could open the door to all-time highs.
Outlook
With Sensex trading close to resistance, profit booking is expected unless a strong breakout materializes. If global markets remain supportive, momentum could take the index beyond 83000. Caution is advised if 81583 breaks, as it might invite broader correction.
📌 Conclusion: Volatility Ahead — Stay Nimble, Stay Informed
This week, markets are delicately poised. With tight ranges across all major indices, a breakout or breakdown could offer strong trading opportunities. Watch for volumes near resistance levels and respect support zones for potential reversals.
📍 Levels to Watch:
Nifty50
-
Support: 24777 / 24550
-
Resistance: 25000 / 25061 / 25110 / 25200
Bank Nifty
-
Support: 55200 / 54500
-
Resistance: 55600 / 55750 / 55850
Sensex
-
Support: 81800 / 81583
-
Resistance: 82500 / 82721 / 83000
📉 Stock Market Disclaimer
Disclaimer: This post is for informational and educational purposes only and does not constitute financial advice or a recommendation to buy/sell any stock or share. Investing in the stock market involves risk. Past performance is not indicative of future results. Always conduct your own research or consult a licensed financial advisor before making investment decisions.