
The Indian stock market continues its vibrant momentum as reflected in the Nifty50, Bank Nifty, and Sensex 15-minute charts. Let’s decode today’s intraday trend, critical support & resistance levels, and strategic insights for traders aiming to capitalize on this market structure. This detailed outlook is your guide to plan your trades smartly for the next session.
📌 🔍 Nifty50 15-Min Chart Analysis
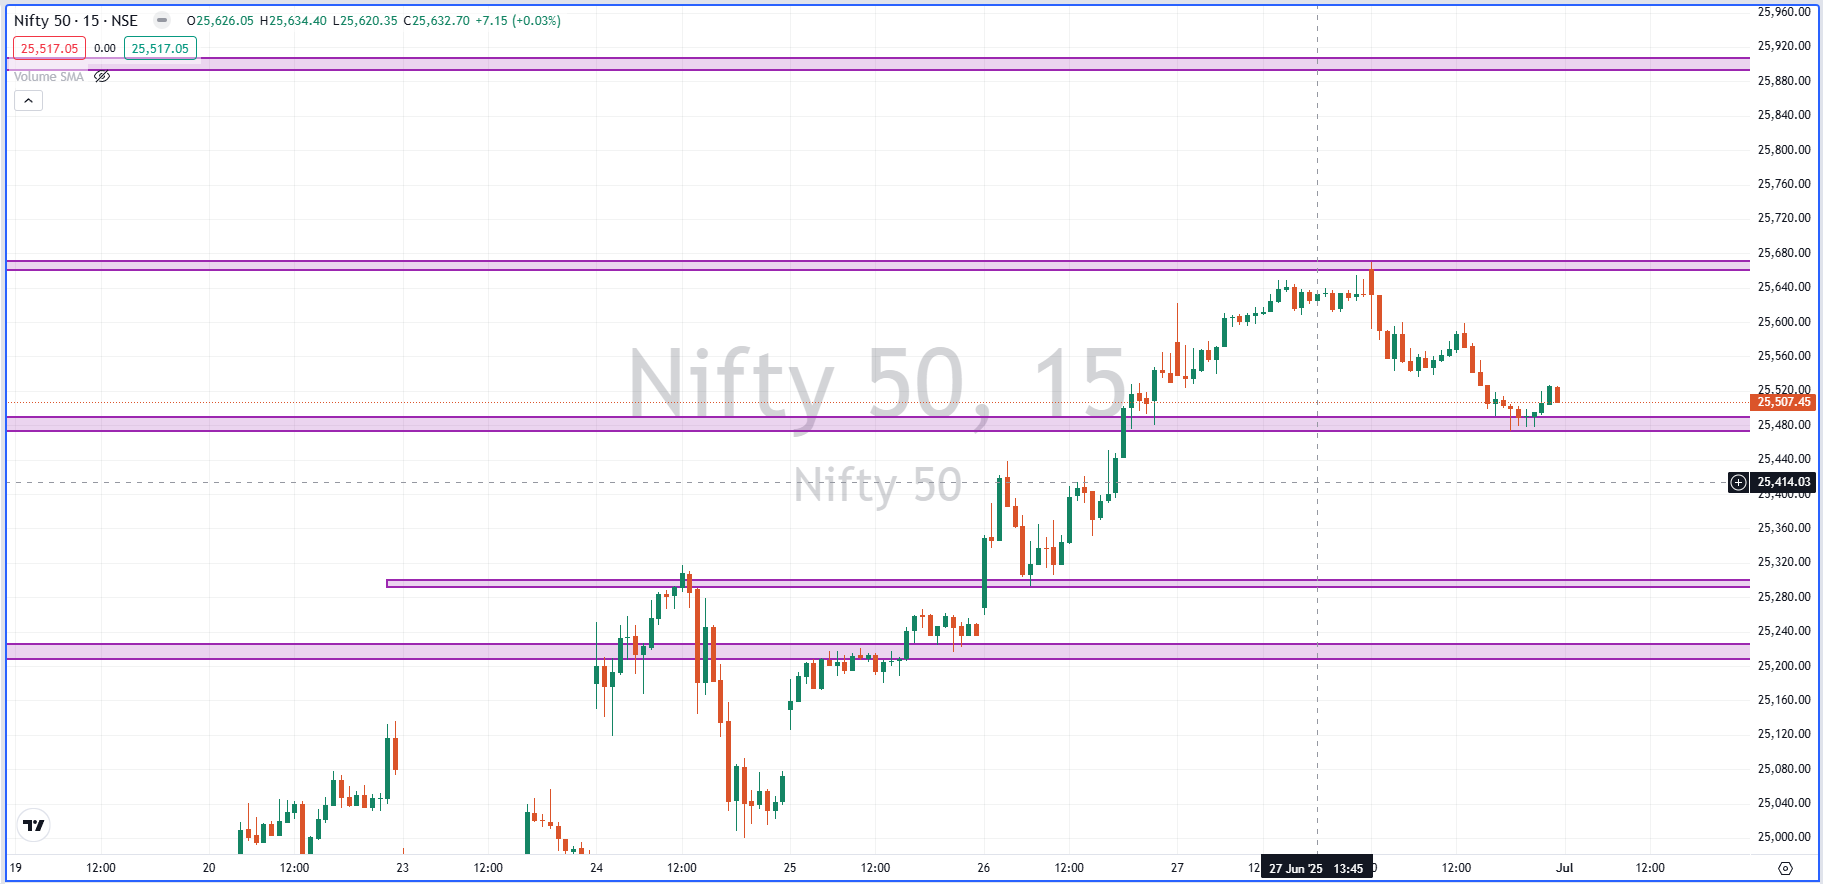
According to the latest 15-minute chart:
-
Support Levels: 📉 25,507 & 25,280
-
Resistance Levels: 📈 25,650 & 25,890
-
Current Trend: Strong Uptrend
The Nifty50 index is currently exhibiting a clear bullish structure, with buyers comfortably defending key supports around 25,500 and aggressively pushing toward higher resistances near 25,650 and 25,890. Traders should watch for a breakout above 25,650, which can potentially trigger a swift move toward 25,890 and beyond.
📌 🏦 Bank Nifty 15-Min Chart Snapshot
For Bank Nifty:
-
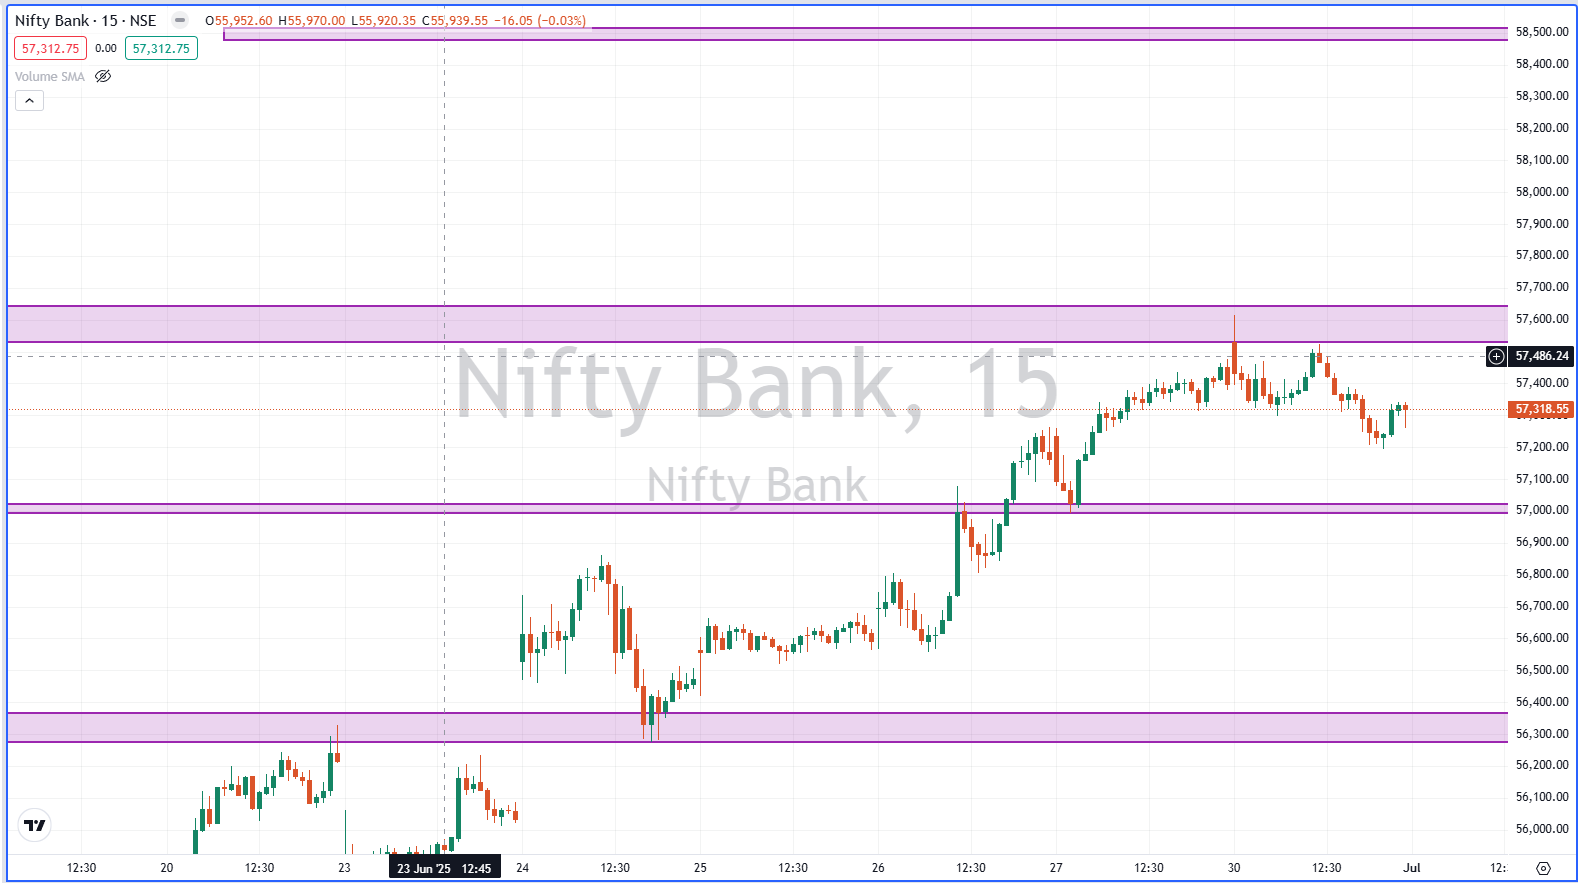
Major Supports: 🟢 57,000, 56,800, 56,600
-
Key Resistances: 🚩 57,500, 57,700, 58,500
Bank Nifty is aligned with the broader market’s uptrend. The financial index has its first cushion at 57,000 — any dip near this could be an opportunity for traders to enter long positions with tight stop-loss levels. A decisive close above 57,500 will strengthen the bullish sentiment, opening gates for 57,700 and eventually 58,500.
📌 📊 Sensex 15-Min Chart Levels
For Sensex traders:
-
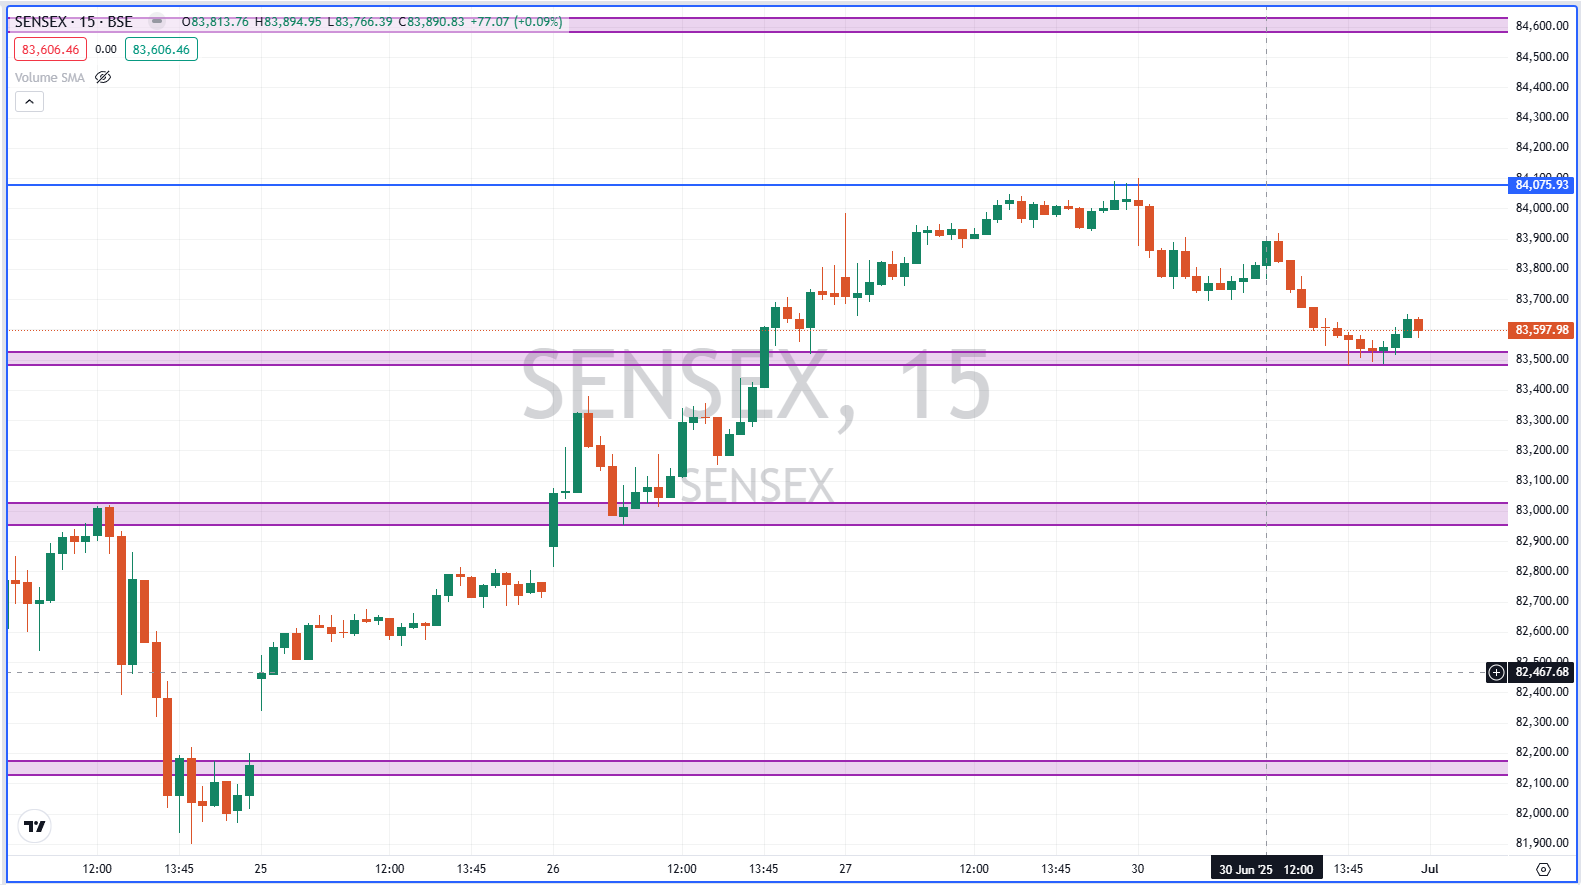
Support Zones: 83,597 & 83,000
-
Resistance Zones: 84,075 & 84,600
The Sensex mirrors Nifty’s bullish undertone. Bulls are likely to protect the psychological 83,000 mark, while crossing above 84,075 could pave the path toward testing 84,600. Intraday traders should trail stop losses and book partial profits at key levels.
💡 🔑 What This Means For The Share Market
✔️ The overall market bias is strongly bullish in the short-term.
✔️ Investors can expect positive cues if the index sustains above immediate resistances.
✔️ Any pullbacks should be seen as a buying opportunity until the trend reverses below the lower supports.
✔️ Volatility may spike near resistance zones — intraday traders should be vigilant during breakout or reversal setups.
🏢 Quick Insight: About Nifty50, Bank Nifty & Sensex
-
Nifty50 represents the weighted average of 50 of the largest Indian companies listed on the National Stock Exchange (NSE).
-
Bank Nifty is an index that captures the performance of the most liquid and large-cap banking stocks.
-
Sensex, India’s oldest index, includes 30 financially sound and well-established companies listed on the Bombay Stock Exchange (BSE).
These indices are the pulse of India’s equity market, guiding retail traders, FII flows, and institutional strategies alike.
📅 📈 Current Key Market Data
Here’s a snapshot of the latest performance:
-
Nifty50: Trading around 25,550–25,600 (approx.), moving steadily in an uptrend.
-
Bank Nifty: Hovering near 57,200–57,400, aligning with the Nifty50’s bullish tone.
-
Sensex: Positioned near 83,800–84,000 with buyers showing strong intent to scale higher.
Note: Traders must watch global cues, crude oil prices, and the US market’s overnight moves, which often impact the opening trend.
✍️ Intraday Trading Strategy: Key Points
Here’s your pointwise checklist to navigate today’s session:
✔️ 🔑 Trade with the trend: Stay long above support levels; avoid aggressive shorts unless major support breaks.
✔️ 🔎 Monitor price action: Watch for candlestick rejections or breakouts at resistance zones.
✔️ 💼 Use tight stop losses: Place stops slightly below immediate supports for long positions.
✔️ 📅 Check volumes: High volumes near resistances may hint at breakout sustainability.
✔️ 📊 Risk management: Avoid over-leveraging; follow proper position sizing.
✔️ 📣 Stay updated: Track economic announcements or corporate results that can sway market momentum.
🔚 📢 Final Word For Traders
Today’s Nifty50, Bank Nifty, and Sensex 15-min chart clearly hint at a bullish bias. Short-term traders should respect the trend and ride the momentum with a disciplined approach. Keep your levels handy, stick to your plan, and remember — market discipline beats prediction!
📉 Stock Market Disclaimer
Disclaimer: This post is for informational and educational purposes only and does not constitute financial advice or a recommendation to buy/sell any stock or share. Investing in the stock market involves risk. Past performance is not indicative of future results. Always conduct your own research or consult a licensed financial advisor before making investment decisions.