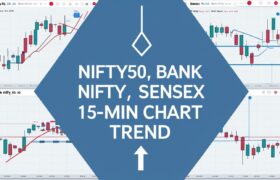
As we move deeper into the trading week, the Indian markets continue to show signs of consolidation, with the Nifty50 and Bank Nifty oscillating between crucial support and resistance levels. Traders and investors are watching these ranges closely for a potential breakout or breakdown, especially ahead of any macroeconomic data or global cues.
In this analysis, we decode the 15-minute chart structure for Nifty50 and Bank Nifty, outlining the key levels to watch, chart patterns to consider, and trading strategy zones that could help navigate the short-term volatility.
🔍 Nifty50 – Support Holding, Eyes on Breakout?
On the 15-minute timeframe, Nifty50 has been range-bound, showing sideways consolidation with a narrowing range between 24760 (support) and 25200 (resistance).
🔹 Support: 24,760
This level has acted as a strong base for the index in the recent sessions. Buyers are stepping in near this zone, showing confidence and absorbing selling pressure. As long as this support holds, the market bias remains moderately bullish.
🔹 Resistance: 25,200
Nifty has struggled to sustain above this mark. It’s a psychological and technical barrier. A clean breakout above 25,200, especially with volume confirmation, could open doors to 25,300–25,500 levels in the short term.
🔸 Chart Observation:
-
Consolidation pattern between 24,760 and 25,200.
-
A breakout or breakdown is imminent – volatility likely to increase.
-
Momentum indicators like RSI and MACD (on 15-min charts) are neutral but poised for directional moves.
🎯 Trading Strategy:
-
Long above 25,200 with a target of 25,350 and stop-loss at 25,050.
-
Short below 24,760 with a target of 24,600 and stop-loss at 24,900.
-
In between, range-bound trades with tight stop-losses may be deployed by experienced traders.
🏦 Bank Nifty – Volatile Yet Structured Moves
Bank Nifty, often the key driver of market sentiment, is showing more complex movements, with traders watching two layers of support and resistance.
🔹 Support Levels:
-
Primary Support: 55,200
-
Deeper Support: 54,500 (only if the former fails)
These levels represent critical zones for bulls. A dip to these areas may invite strong buying, especially from swing traders and institutions.
🔹 Resistance Levels:
-
Immediate Resistance: 55,600
-
Next Resistance: 55,750
Breakouts above these resistance levels can drive momentum-led rallies, especially in frontline private and PSU banks.
🔸 Chart Setup:
-
Sideways to slightly bullish structure with visible higher lows forming.
-
Expectation of a triangle breakout on either side as volume builds up.
🎯 Trade Setups:
-
Buy on dips near 55,200, SL at 54,950, upside target of 55,600/55,750.
-
Sell if price breaks below 54,500, targeting 54,100 with a stop-loss at 54,700.
-
Above 55,750, fresh long build-up expected, particularly in HDFC Bank, ICICI Bank, and SBI.
🔔 Key Takeaways and Trend Outlook
-
Nifty50 is in a pre-breakout phase, consolidating in a tight range of 440 points (24,760–25,200). A decisive move in either direction will likely dictate the week’s trend.
-
Bank Nifty is slightly more volatile, but showing strength above 55,200. Traders should watch the 55,750 resistance for breakout confirmation.
-
Market breadth remains neutral; global cues and FII-DII activity could act as triggers.
-
Traders are advised to wait for confirmation before taking directional bets and should maintain disciplined stop-loss practices due to increased intraday volatility.
📌 Levels to Watch (Summary)
| Index | Support Levels | Resistance Levels |
|---|---|---|
| Nifty50 | 24,760 | 25,200 |
| Bank Nifty | 55,200 / 54,500 (deep) | 55,600 / 55,750 |
🧭 Final Word
As we move forward, these well-defined ranges in Nifty50 and Bank Nifty offer excellent trade opportunities, especially for intraday and swing traders. The market appears to be coiling for a larger move – so this is a time to stay alert, trade light, and focus on price action near critical levels.
Keep an eye on breakouts above resistance or breakdowns below support to time your entries with greater precision. Until then, tight range-bound trades with sharp discipline can help manage risk and ride the volatility with control.
📉 Stock Market Disclaimer
Disclaimer: This post is for informational and educational purposes only and does not constitute financial advice or a recommendation to buy/sell any stock or share. Investing in the stock market involves risk. Past performance is not indicative of future results. Always conduct your own research or consult a licensed financial advisor before making investment decisions.


