
Market Overview:
The Nifty 50 index has recently shown signs of short-term weakness after failing to sustain above a critical resistance zone. After experiencing a sharp rally post-25th June 2025, the market attempted consolidation above the 25,500 levels but is now facing pressure, as seen by the rejection from higher resistance levels and a breakdown of the rising trendline support.
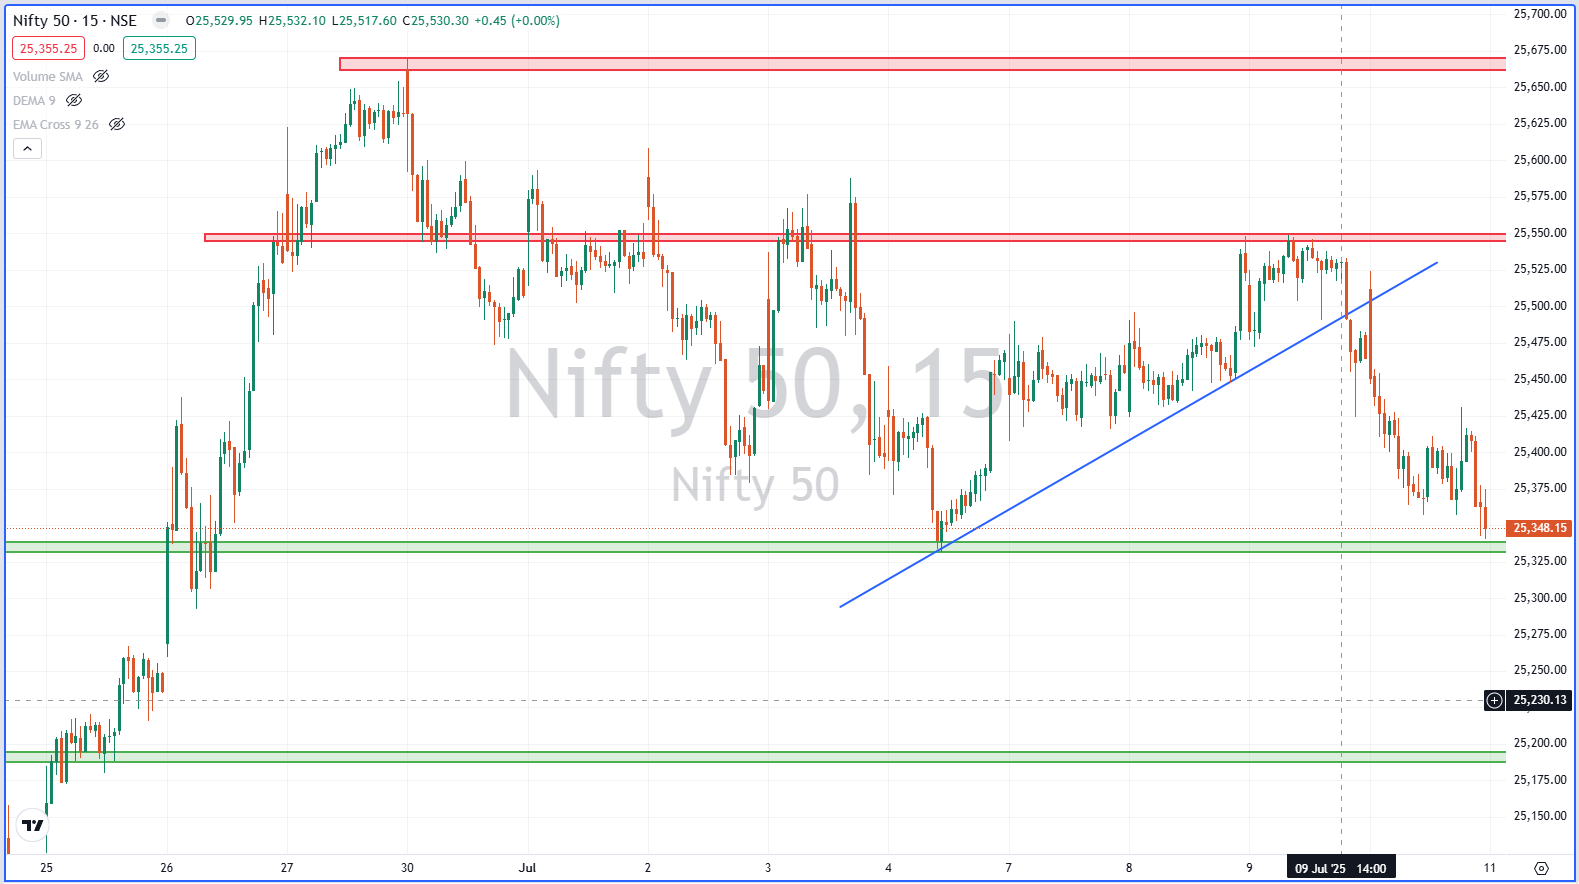
As of the closing of 9th July 2025, the Nifty stood at 25,348.15, marginally up by 0.45 points (+0.00%). Although this flat closing does not reveal much on the surface, the underlying chart structure tells a different story—one of weakening bullish momentum and a possible short-term correction brewing.
📉 Technical Chart Analysis:
1. Timeframe Observed: 15-Minute Chart
The analysis is based on the 15-minute timeframe, which is particularly useful for intraday to short-term swing traders. This timeframe helps identify near-term momentum, support/resistance, and breakout/breakdown opportunities.
2. Key Price Levels Observed:
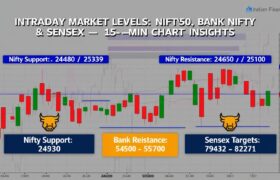
🔴 Resistance Zones (Red Lines on Chart):
-
25,670–25,685: Strong resistance zone marked by multiple rejections in early July. Price faced a sharp pullback from this level.
-
25,545–25,565: Intermediate resistance where the index struggled to hold after multiple attempts to break higher.
-
25,510–25,530: Short-term supply zone, previously acting as a support, turned into resistance.
🟢 Support Zones (Green Lines on Chart):
-
25,325–25,345: Immediate support zone where price is currently hovering. Any breakdown below this range could lead to further downside.
-
25,230–25,250: Stronger support, aligned with previous demand zones and a base for the rally observed from late June.
-
25,140–25,180: Lower major support that could be revisited in case of a broader correction.
Nifty 50
3. Trendline Analysis:
A blue upward trendline supported the price action from the 4th to the 8th of July. However, the index broke below this trendline on 9th July, signaling weakness and a possible change in short-term trend.
This breakdown was accompanied by a steady decline in price action, lower highs, and increased selling pressure near resistance levels, confirming bearish sentiment for the short term.
4. Candlestick Behavior:
The chart reveals multiple long upper wicks near resistance zones, particularly around 25,545–25,570, indicating consistent selling pressure at higher levels. The bearish engulfing pattern seen near 25,530 further validated the rejection.
On the downside, we observe small-bodied candles with long lower shadows around 25,350–25,325, suggesting that buyers are attempting to hold the level, but confidence is lacking.
5. Volume & EMA Observation:
Though volume data isn’t clearly visible in the chart, the price action and the moving average behavior (likely the 9 EMA and 26 EMA cross) suggest a loss in bullish momentum.
The price staying below the 9 EMA and EMA cross pointing downward supports the view of bearish bias in the short term.
📉 Market Sentiment & Probable Scenarios:
Bearish Bias Confirmed – Breakdown Likely If 25,325 Is Breached
-
The current market structure suggests a short-term bearish trend, especially after the break of the ascending trendline.
-
If the index decisively breaks below 25,325, we may see a quick dip toward 25,230, and if selling pressure intensifies, the index may retest 25,180–25,150 zones.
Neutral-to-Bullish Recovery – Watch for Reclaim of 25,510+
-
In case the market finds strong support at current levels and manages to reclaim 25,510, we may see another attempt to retest 25,545 and higher resistance around 25,670.
-
This scenario, however, currently seems less probable unless aided by positive global cues or strong sectoral leadership.
🔍 Sectoral Influence on Nifty’s Move:
Likely Contributors to Recent Fall:
-
Banking Stocks: Profit booking in frontline banks may have dragged the index lower.
-
IT Sector: Weak US market cues and Nasdaq pullback likely impacted tech-heavyweights.
-
Auto & FMCG: Sector rotation likely caused a move away from these recently rallied stocks.
Sectors to Watch Ahead:
-
Metals: May see short-term strength due to rising global commodity prices.
-
Pharma: Defensive buying might come into play if market corrects further.
-
Energy: Volatility in crude oil may impact the performance of Reliance & ONGC.
🧭 Trading Strategy for 10th July 2025:
📌 Intraday Traders:
-
Short below 25,325, Target: 25,250 / 25,180, SL: 25,370
-
Long above 25,510, Target: 25,550 / 25,600, SL: 25,470
📌 Swing Traders:
-
Watch for breakdown retest confirmation of 25,325 for a possible 2–3 day short position.
-
Avoid long positions unless Nifty gives a strong close above 25,545 with volume.
💬 Expert Quote to Ponder:
“Markets are never wrong – opinions often are.” – Jesse Livermore
This resonates perfectly with the current Nifty setup, where bias must adjust with price confirmation.
Note: This is the Testing Real data may be differ for above
Stock Market Disclaimer
Disclaimer: This post is for informational and educational purposes only and does not constitute financial advice or a recommendation to buy/sell any stock or share. Investing in the stock market involves risk. Past performance is not indicative of future results. Always conduct your own research or consult a licensed financial advisor before making investment decisions.