
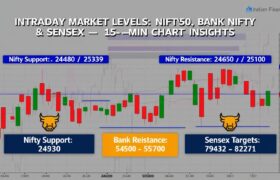
As we step into another trading session, the 15-minute chart technicals offer a sharp view into potential breakout and breakdown levels across major indices. In this technical snapshot, we dissect the Nifty50, Bank Nifty, and Sensex charts to decode crucial support, resistance, and trend levels that every trader should monitor closely.
📊 Nifty50: Consolidation Ahead or Breakout Brewing?
Nifty50 continues to flirt near critical resistance zones, suggesting a possible breakout above immediate highs or a dip to test lower support levels if momentum weakens.

Key Support Levels:
-
24480: First immediate support – a breach here may invite short-term selling pressure.
-
23939: Deeper support – a critical level that could serve as a bounce zone for buyers.
Key Resistance Levels:
-
24650: Short-term cap; needs volume-driven momentum to be crossed convincingly.
-
24800 & 24950: Mid-resistance zones; could see profit booking if tested.
-
25100: Major psychological and technical resistance – breaking this level may set the stage for a fresh bull run.
📌 Technical Insight:
A breakout above 24650 with good volumes could initiate a rally toward 24950–25100. However, a failure to hold above 24480 may bring 23939 into play. The market remains in a wait-and-watch mode until a decisive direction unfolds.
🏦 Bank Nifty: Volatility Widening the Playbook
Bank Nifty, the banking heavyweight index, is showcasing signs of increased volatility, giving traders wider range setups for intraday and swing positions.

Support Levels:
-
54830: Initial support; holds the key for short-term stability.
-
54500: A more substantial support level – watch for strong buying interest here.
Resistance Levels:
-
55200: First overhead supply zone.
-
55500 & 55700: Zones that could limit upside momentum unless backed by strong financial sector moves.
📌 Trading Outlook:
As long as Bank Nifty holds above 54830, bulls may attempt to scale back toward 55200–55500. A slip below 54500 could bring a sharper correction. Consider range-bound strategies until a directional breakout emerges.
📈 Sensex: Treading Water with Bullish Intent?
The Sensex has been relatively stable with a slight bullish tilt on lower timeframes. It’s trading within a narrowing band, signaling a potential squeeze ahead.

Support Zones:
-
80654: First line of defense for bulls.
-
79432: Key deeper support – any sustained breach may rattle sentiment.
Resistance Hurdles:
-
81400: Short-term resistance to watch.
-
81800 & 82721.32: Bullish breakout levels – likely targets on sustained up moves.
📌 Chart Watch:
If Sensex crosses 81400 convincingly, momentum traders can aim for 82700+ targets. On the downside, 80650 is a must-hold level for intraday bulls to retain control.
🔍 Key Levels to Watch (Snapshot)
| Index | Support Levels | Resistance Levels |
|---|---|---|
| Nifty50 | 24480 / 23939 | 24650 / 24800 / 24950 / 25100 |
| Bank Nifty | 54830 / 54500 | 55200 / 55500 / 55700 |
| Sensex | 80654 / 79432 | 81400 / 81800 / 82721.32 |
📉 Stock Market Disclaimer
Disclaimer: This post is for informational and educational purposes only and does not constitute financial advice or a recommendation to buy/sell any stock or share. Investing in the stock market involves risk. Past performance is not indicative of future results. Always conduct your own research or consult a licensed financial advisor before making investment decisions.