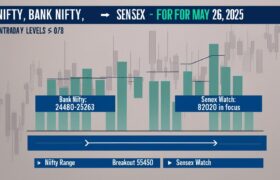
Nifty50, Bank Nifty, and Sensex Technical Overview (15-Min Chart Based)
As the Indian equity markets prepare for the week’s final session on Monday, May 26, 2025, technical indicators from the 15-minute charts suggest a mixed setup with potential for directional moves. The short-term levels highlight strong interest zones, indicating key decision points for traders and investors. Let’s break down the near-term technical structure across Nifty50, Bank Nifty, and Sensex, keeping in mind macro developments, sectoral rotation, and institutional behavior.
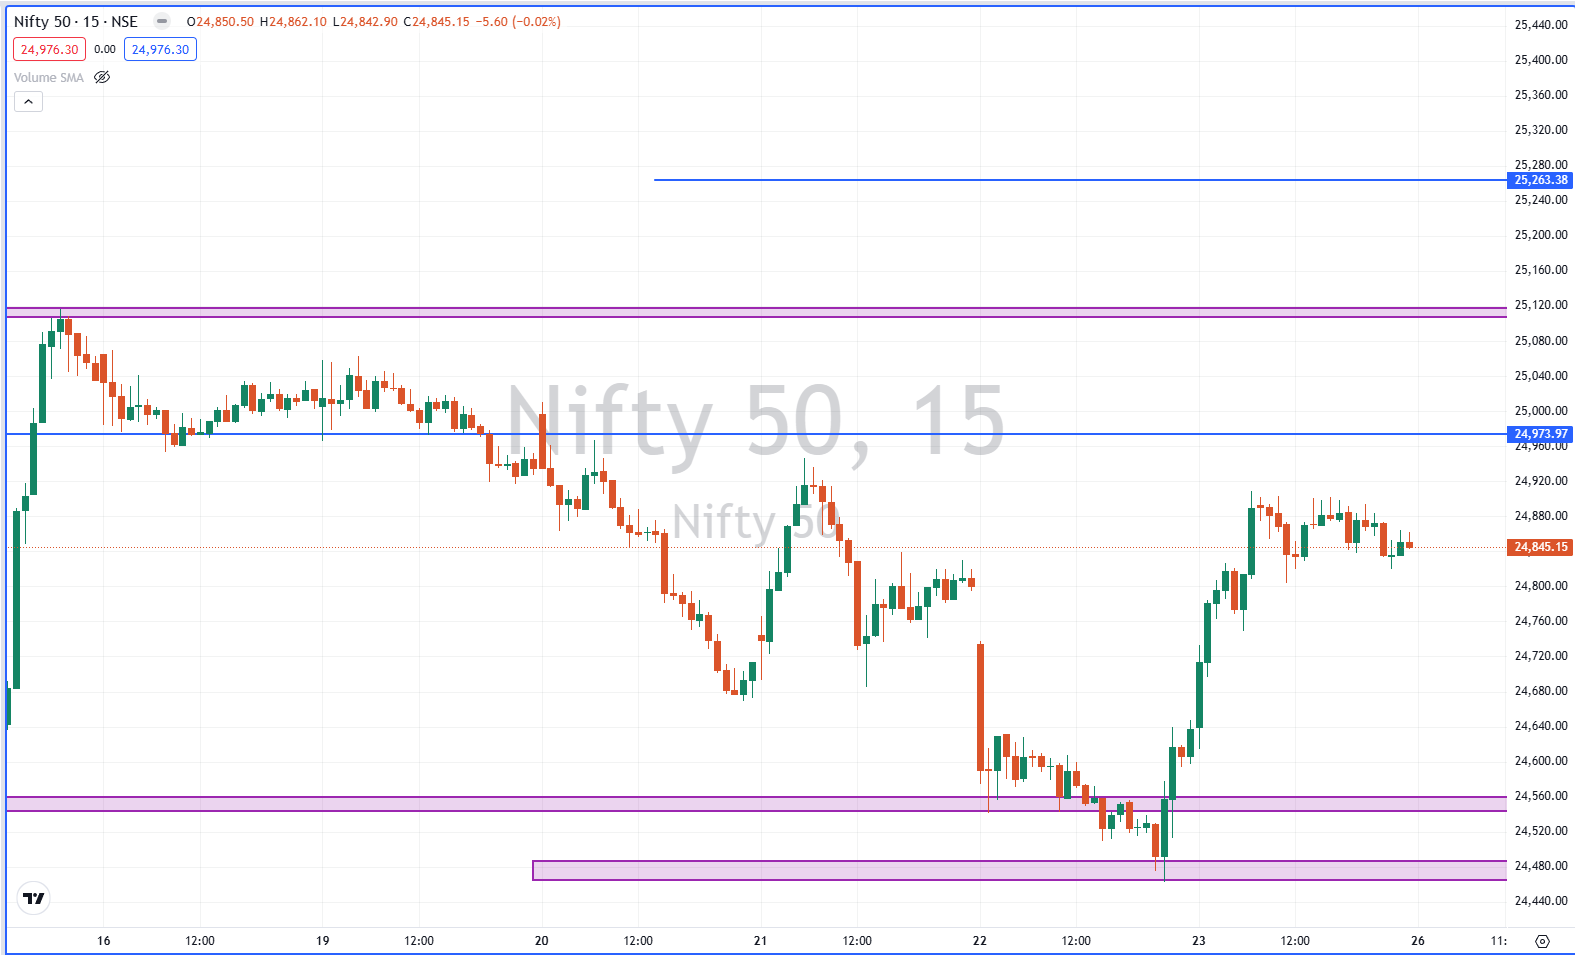
🔍 Nifty50: Bulls Eyeing 25120 – Can the Index Sustain Momentum?
Nifty50 continues its gradual upward drift with minor consolidations near critical supply zones. With the global markets maintaining a risk-on tone and domestic sentiment bolstered by strong institutional flows, the index is inching closer to resistance zones where volatility may increase.
🔧 Technical Levels:
-
Support:
-
24560: Near-term cushion; a break could invite minor correction.
-
24480: Deeper demand zone – likely to hold if markets remain stable.
-
-
Resistance:
-
24973: Immediate ceiling – breaching this may attract fast intraday moves.
-
25120: Psychological level and Fibonacci retracement resistance.
-
25263: Extended target for a bullish breakout.
-
📌 Actionable Insight:
Expect sideways consolidation between 24560–24973. A breakout above 24973 can potentially fuel a quick rally toward 25263, especially if banking and auto stocks provide support. On the downside, a breach below 24480 may drag the index toward 24250 zones.
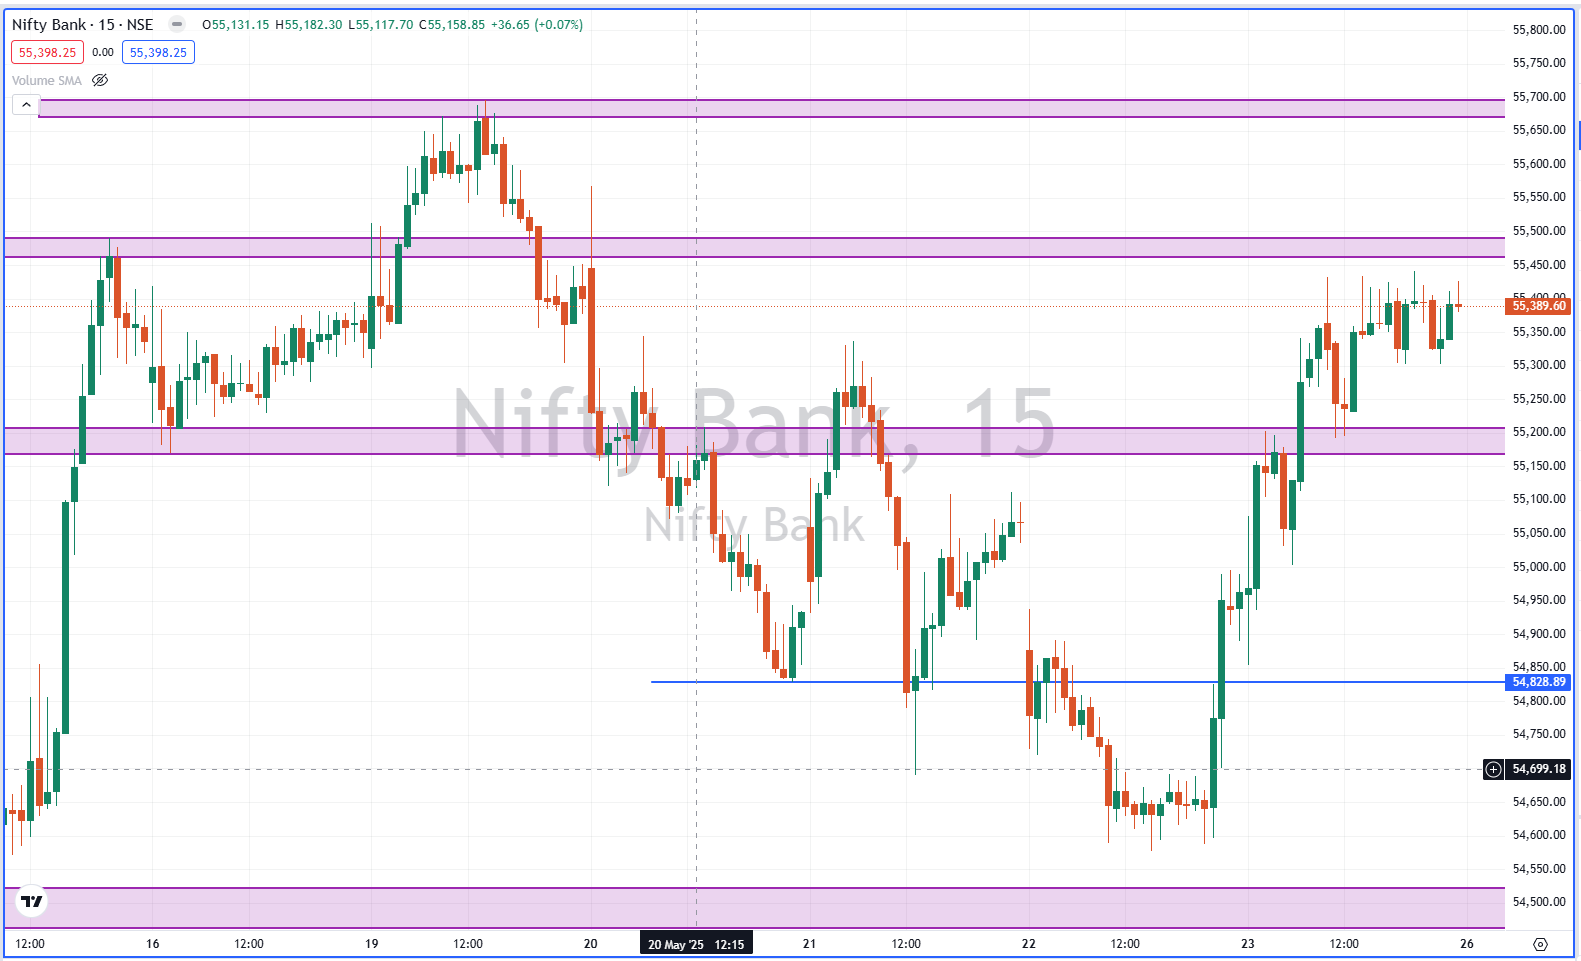
🏦 Bank Nifty: Volatility Watch Around 55450 – Range Likely to Expand
Bank Nifty has been the driver of momentum recently, especially with private sector lenders showing strength. The 15-minute chart reveals a critical inflection near 55450, where bulls and bears are likely to fight for control. Expect sharp moves above or below this mark.
🔧 Key Levels:
-
Support:
-
54830: First zone of interest for intraday pullbacks.
-
54500: Stronger support base and a potential rebound zone.
-
-
Resistance:
-
55450: Crucial barrier – watch for breakout confirmation with volume.
-
55700: Bullish target if 55450 is cleared with momentum.
-
📌 Strategic Note:
Buy-on-dips strategy remains favorable above 54830. A strong move past 55450 can unlock a 100–200 point rally. Keep an eye on PSU banking counters and Nifty Financial Services index for cues.
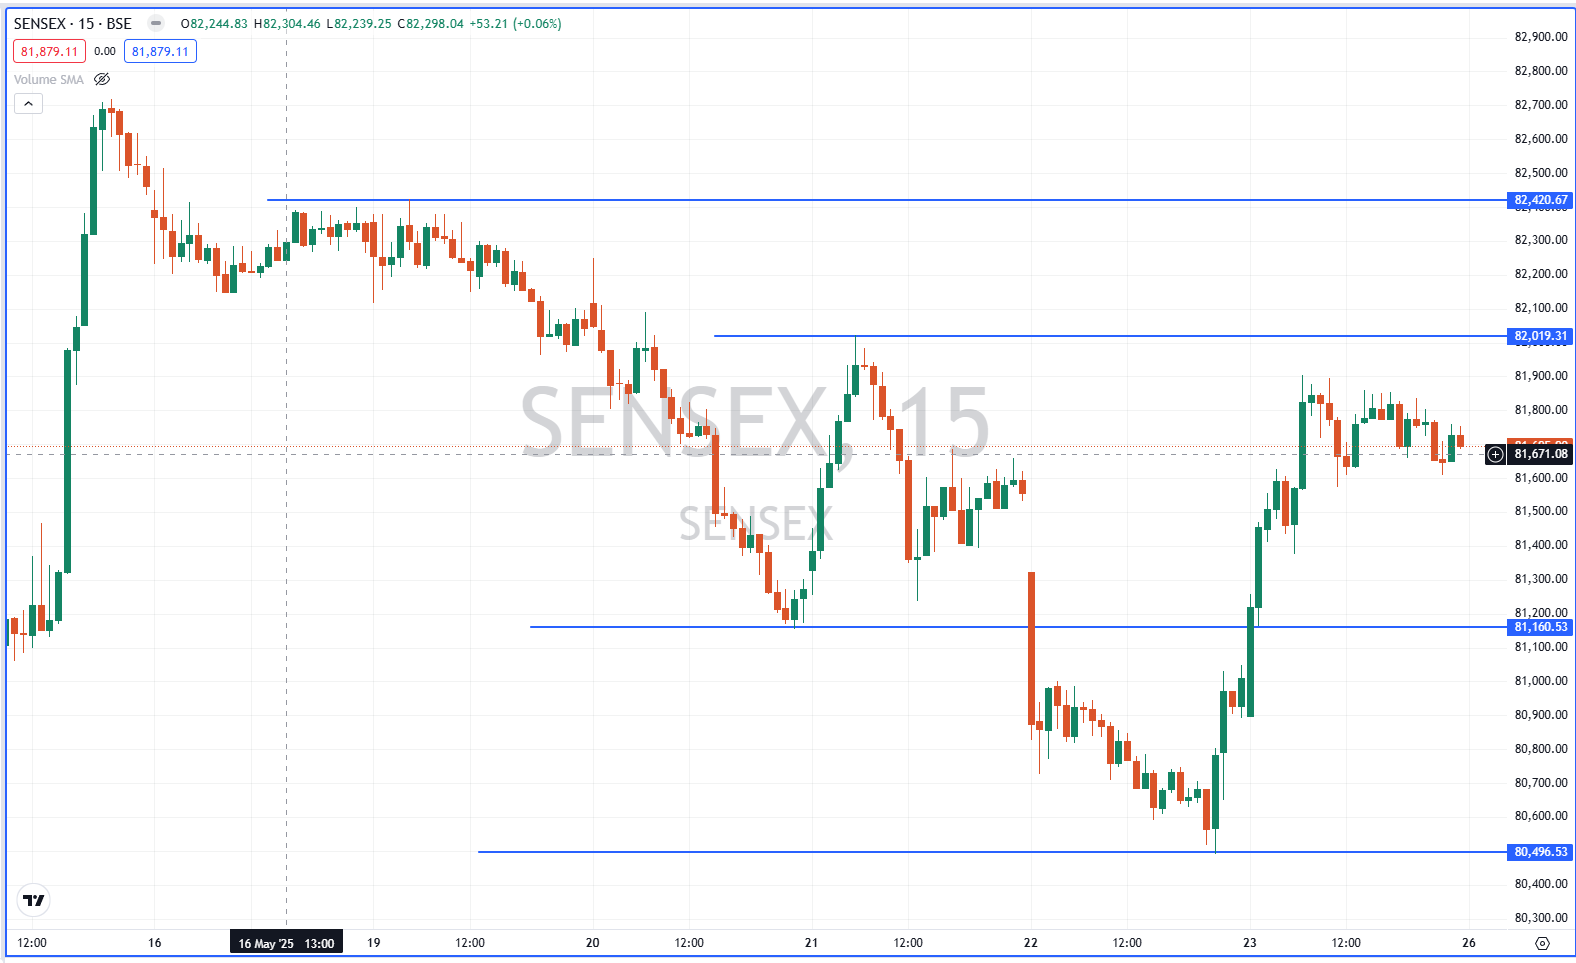
📊 Sensex: Tightly Coiled Between 81160 and 82020 – Watch for Breakout
Sensex appears to be forming a bullish flag pattern on the 15-min timeframe. With multiple attempts to cross 82020, traders are advised to remain vigilant as a breakout could align with broader index strength.
🔧 Crucial Levels:
-
Support:
-
81160: First layer of defense for the bulls.
-
80490: Deeper support, which must hold for any bullish continuation.
-
-
Resistance:
-
82020: Key resistance, multiple rejections observed.
-
82420: Upside target if breakout sustains.
-
📌 Viewpoint:
A range of 80490 to 82420 is in play. Watch for early cues from global markets and heavyweight stock activity. A clean break above 82020 may prompt FOMO buying across broader indices.
🔮 Global Cues and Market Sentiment
-
US tech rally: Nasdaq’s strong weekly close may inspire risk appetite.
-
Crude oil prices: Stable crude is supportive for India’s macros.
-
Rupee: INR’s relative strength against USD supports foreign flows.
FIIs and DIIs remain active participants, indicating robust undercurrents, particularly in large-cap and banking segments.
📌 Trend Summary: Key Takeaways for May 26
| Index | Support Levels | Resistance Levels | Trend Bias |
|---|---|---|---|
| Nifty50 | 24560 / 24480 | 24973 / 25120 / 25263 | Mildly Bullish |
| Bank Nifty | 54830 / 54500 | 55450 / 55700 | Bullish Above 55450 |
| Sensex | 81160 / 80490 | 82020 / 82420 | Sideways-to-Bullish |
📉 Stock Market Disclaimer
Disclaimer: This post is for informational and educational purposes only and does not constitute financial advice or a recommendation to buy/sell any stock or share. Investing in the stock market involves risk. Past performance is not indicative of future results. Always conduct your own research or consult a licensed financial advisor before making investment decisions.